> For the complete documentation index, see [llms.txt](https://docs.nexthink.com/platform/llms.txt). Markdown versions of documentation pages are available by appending `.md` to page URLs; this page is available as [Markdown](https://docs.nexthink.com/platform/platform/ja/user-guide/alerts-and-diagnostics/setting-up-and-managing-monitors/creating-custom-monitors.md).

# カスタムモニターの作成

カスタムモニターを作成するには、ナビゲーションパネルで **アラートと診断** > **アラートを管理** を選択します。

1. ページ右上の **新しいモニター** ボタンをクリックして、モニター設定を開きます。
2. **一般** タブのフィールドに入力します。
3. **NQL クエリと条件** タブを設定します。
   * **トリガー条件** と **スケジュール頻度** を含む
4. プロアクティブなアラート管理のために、[メールまたは webhook 経由の通知を設定](/platform/platform/ja/user-guide/alerts-and-diagnostics/setting-up-and-managing-monitors/configuring-email-and-webhook-notifications-for-alerts.md)します。

<figure><img src="https://3549141153-files.gitbook.io/~/files/v0/b/gitbook-x-prod.appspot.com/o/spaces%2FeLm8O7QKZDn6z806e7Sv%2Fuploads%2Fgit-blob-73ac44d4f17e53ac1493bfe94b2ffae4e0917f54%2Fimage%20(644).png?alt=media" alt=""><figcaption></figcaption></figure>

## モニターの一般設定の構成

{% hint style="info" %}
モニターを一から作成する代わりに、カスタムモニターよりも幅広い機能を提供する組み込みモニターをカスタマイズすることを Nexthink は推奨します。
{% endhint %}

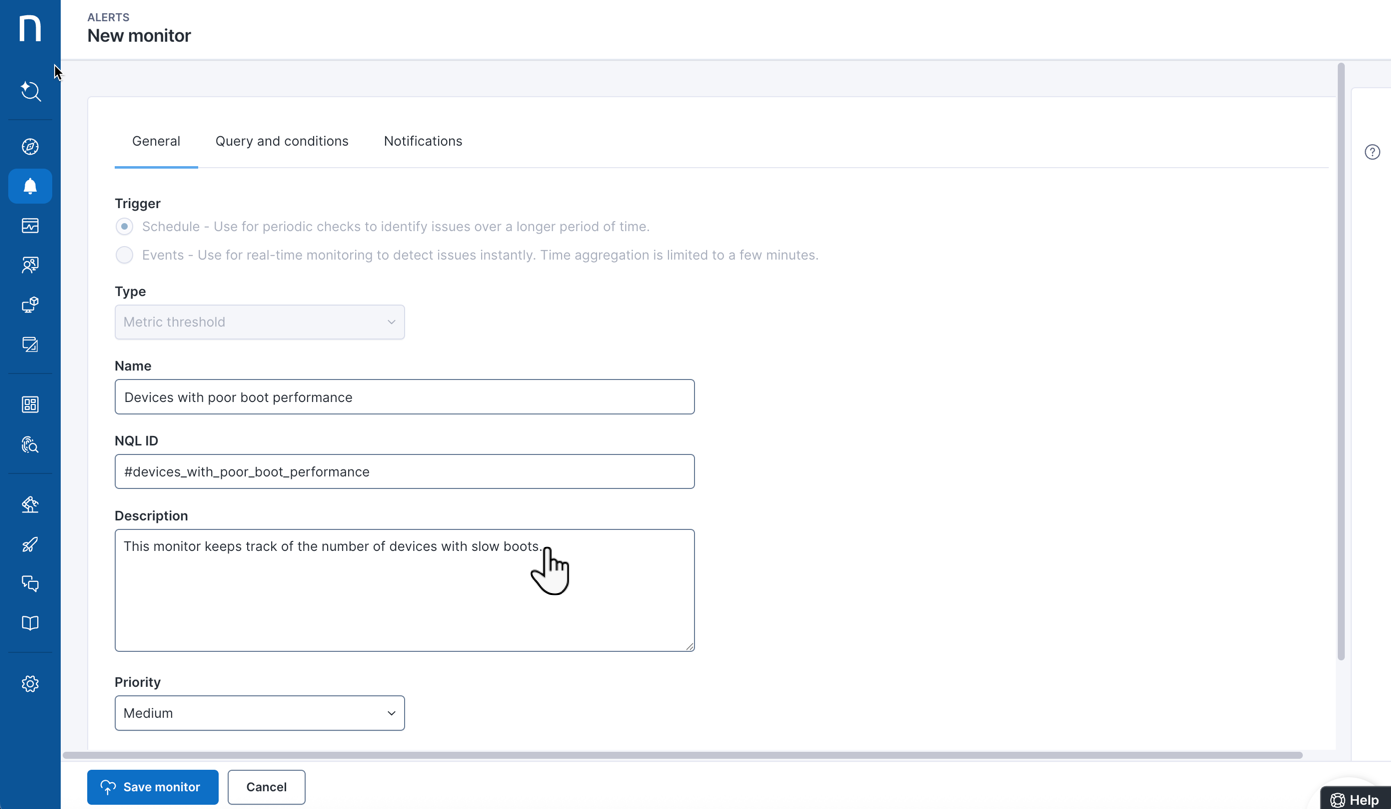
**新しいモニター** 設定ページで、**一般** タブの以下のフィールドに入力します。

<figure><img src="https://3549141153-files.gitbook.io/~/files/v0/b/gitbook-x-prod.appspot.com/o/spaces%2FeLm8O7QKZDn6z806e7Sv%2Fuploads%2Fgit-blob-30a93df370c34c54b26ba9f4a3ab855732f67881%2Fimage%20(642).png?alt=media" alt=""><figcaption></figcaption></figure>

{% hint style="warning" %}
**イベントトリガー** および **グローバル検出** は、組み込みモニター（システムモニターまたは Nexthink Library からインストールしたモニター）でのみ使用できます。
{% endhint %}

* **トリガー:** カスタムモニターでは、定期的なチェックに使用する **スケジュール** トリガー方式を利用できます。**クエリと条件** タブの [スケジュール頻度](#customizingbuilt-inmonitors-schedulingfrequency) セクションで、特定の間隔を設定します。
* **タイプ**: カスタムモニターでは、以下の **タイプ** の検出モードを利用できます。

<details>

<summary>メトリックのしきい値</summary>

**メトリックのしきい値** は、複数のメトリックの値がユーザー定義のしきい値に達したときにアラートをトリガーします。

</details>

<details>

<summary>メトリックの変化</summary>

**メトリックの変化** は、現在のメトリック値が移動 [7日間グローバル平均](/platform/platform/ja/user-guide/alerts-and-diagnostics/alerts-faq.md#how-does-the-system-compute-the-baseline-for-the-detection-methods-metric-change-and-metric-seasonal)と異なる場合にトリガーされます。

</details>

<details>

<summary>メトリックの季節的変化</summary>

**メトリックの季節的変化** は、設定された標準偏差帯に基づき、現在のメトリック値が過去7日間の [時刻別ベースライン](/platform/platform/ja/user-guide/alerts-and-diagnostics/alerts-faq.md#how-does-the-system-compute-the-baseline-for-the-detection-methods-metric-change-and-metric-seasonal)の範囲外になったときにアラートをトリガーします。

</details>

{% hint style="info" %}
**メトリックの変化** または **メトリックの季節的変化** を使用するカスタムモニターは、合計で最大5個まで設定できます

モニターは最大50個まで作成できます。
{% endhint %}

* **名前**: モニターにわかりやすい名前を付けます。システムはこの名前を使用して通知を送信し、アラートの概要ページにモニターを表示します。
* **NQL ID**: システムは、モニターの **名前** から一意の識別子を自動的に生成します。 Nexthink 内でこのモニターをクエリするには、NQL ID を使用します。
  * NQL ID は、モニターの作成中にのみ編集できます。使用できる文字は次のとおりです。\
    `a-z, 0-9, _`。
  * 削除済みモニターに関連付けられたイベントがシステム内に残っている間は（最大30日間）、その削除済みモニターで使用された NQL ID を持つモニターを作成できません。
* **優先度:** 優先度レベルを設定します。デフォルトのレベルは中です。
* **タグ**: モニター用のカスタムタグを作成します。これにより、**アラートの概要** および [Webhook](https://docs.nexthink.com/platform/ja/user-guide/alerts-and-diagnostics/managing-alerts/configuring-email-and-webhook-notifications-for-alerts#configuringemailandwebhooknotificationsforalerts-webhooknotifications) 統合でアラートをフィルタリングできます。現在、モニターごとに最大十個のタグを定義できます。

## カスタムモニターの NQL クエリと条件の定義 <a href="#creatingcustommonitors-definingannqlquery" id="creatingcustommonitors-definingannqlquery"></a>

モニター設定ページで、**クエリと条件** タブの以下のフィールドに入力します。

必要に応じて、**調査で表示** ボタンをクリックすると、クエリ調査結果を表示できます。

<figure><img src="https://3549141153-files.gitbook.io/~/files/v0/b/gitbook-x-prod.appspot.com/o/spaces%2FeLm8O7QKZDn6z806e7Sv%2Fuploads%2Fgit-blob-910247da1cee27044fbe6edb34f7c4195b27cbef%2Fimage%20(643).png?alt=media" alt=""><figcaption></figcaption></figure>

1. 監視するメトリックを定義する **NQL クエリ** を記述します。 NQL では、次のことができます。
   * 一つまたは複数のメトリックを選択する。
   * `where` 句を使用してスコープを指定する。
   * 時間集計とグループ化のための `by` キーワードを使用して、アラートの粒度を定義する。

{% hint style="warning" %}
10,000を超える結果コンテキストまたはグループを計算する NQL クエリでは、システムにエラーメッセージが表示されます。この場合、グループごとに独自の [ベースライン](/platform/platform/ja/user-guide/alerts-and-diagnostics/getting-started-with-alerts.md#baseline-computation-depending-on-the-alert-detection-mode)が必要となるため、`by` 句を簡略化するかフィルターを追加して、粒度を下げてください。
{% endhint %}

<details>

<summary>モニタークエリの NQL ルールと制限事項</summary>

モニターをサポートするには、NQL クエリがいくつかのルールに従う必要があります。

1. モニター用の NQL クエリには、計算済みまたは集計済みメトリックを含める必要があります。つまり、すべてのクエリにはモニターと互換性を持たせるために `compute` または `summarize` 句が必要です。

```
devices
| with device_performance.system_crashes during past 7d 
| compute 
  total_number_of_system_crashes = number_of_system_crashes.sum()
```

```
execution.crashes during past 24h
| summarize total_number_of_crashes = count()
```

{% hint style="info" %}
システムは、モニター設定で `devices` と `mobile_devices` の両方のクエリもサポートしています。
{% endhint %}

2. 必要に応じて、アラートをトリガーする複数の条件を設定するために、クエリに複数の計算済みまたは集計済みメトリックを含めます。

```
execution.crashes during past 24h
| summarize 
  total_number_of_crashes = count(), 
  devices_with_crashes = device.count()
```

3. 監視条件のしきい値を設定するには、少なくとも一つのメトリックを使用します。元のクエリにメトリックが含まれていない場合は、追加のメトリックを作成します。

モニターと互換性がありません:

```
devices
| with antiviruses
| where is_up_to_date == no
```

モニターと互換性があります:

```
devices
| with antiviruses
| where is_up_to_date == no
| compute device_count = count()
```

4. 評価対象メトリックの条件を NQL レベルで追加しないでください。代わりに、[トリガー条件](#creatingcustommonitors-definingtriggerconditionstriggercondition) セクションを使用して条件を定義します。

誤ったモニター NQL クエリ:

```
execution.crashes during past 24h
| summarize total_number_of_crashes = count()
| where total_number_of_crashes >= 10
```

条件を含む正しいモニター NQL クエリ:

```
execution.crashes during past 24h
| summarize total_number_of_crashes = count()
```

5. `where` 句を使用して、モニターのスコープを特定の場所、アプリケーション、その他のカテゴリに絞り込みます。

```
execution.crashes during past 24h
| where binary.name == "excel.exe"
| summarize total_number_of_crashes = count()
```

6. `summarize… by` を使用して、アラートコンテキストに適した粒度を定義します。以下の例では、バイナリ名ごとに一つのアラートがトリガーされます。

```
execution.crashes during past 24h
| summarize total_number_of_crashes = count() by binary.name
```

7. モニタークエリで機密性の高いユーザー情報およびデバイス情報を公開しないようにしてください。 `user.name` や `device.name` などのフィールドは、モニタークエリで直接使用できません。これらを含めると、アラートへのアクセス権を持つすべてのユーザーに表示されます。代わりに、`user.sid` や `device.collector.uid.` などのフィールド識別子を使用します

モニターと互換性がありません:

{% code overflow="wrap" %}

```
execution.crashes during past 24h
| summarize total_crashes = count() by user.name, device.name
```

{% endcode %}

モニターと互換性があります:

{% code overflow="wrap" %}

```
execution.crashes during past 24h
| summarize total_crashes = count() by user.sid, device.collector.uid
```

{% endcode %}

NQL クエリの定義について詳しくは、[複数のデバイスに影響する問題の検出](/platform/platform/ja/user-guide/alerts-and-diagnostics/setting-up-and-managing-monitors/creating-custom-monitors/detecting-issues-impacting-multiple-devices.md)および[単一のデバイスまたはユーザーに影響する問題の検出](/platform/platform/ja/user-guide/alerts-and-diagnostics/setting-up-and-managing-monitors/creating-custom-monitors/detecting-issues-impacting-a-single-device-or-user.md)のドキュメントを参照してください。

</details>

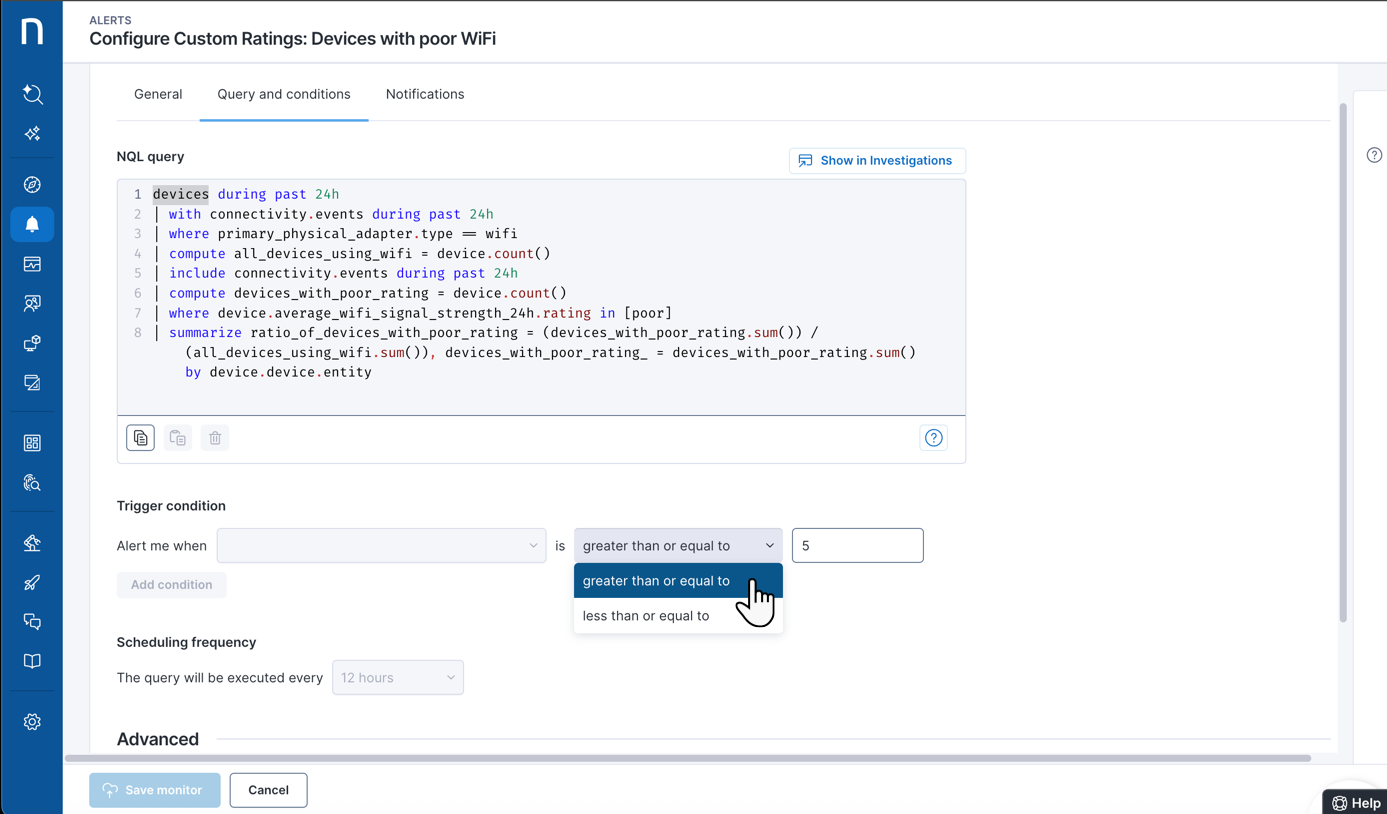
2. アラートを有効にする **トリガー条件** を定義します。トリガー条件は、モニターに選択した検出 **タイプ** によって異なります。\
   条件を絞り込むには、NQL クエリで計算された各メトリックを使用します。

<details>

<summary><strong>メトリックのしきい値</strong>のトリガー条件</summary>

**メトリックのしきい値** 検出&#x6E;**,** を使用するモニターの **トリガー条件** では、メトリック値が指定値 **以上** または **以下** になると、モニターがアラートをトリガーします。

すべてのトリガー条件が満たされると、システムはアラートをトリガーします。

<figure><img src="https://3549141153-files.gitbook.io/~/files/v0/b/gitbook-x-prod.appspot.com/o/spaces%2FeLm8O7QKZDn6z806e7Sv%2Fuploads%2Fgit-blob-6c04a20488c1cf804afb137ab6b345844a1ab0d6%2Fimage%20(635).png?alt=media" alt=""><figcaption></figcaption></figure>

</details>

<details>

<summary><strong>メトリックの変化</strong>のトリガー条件</summary>

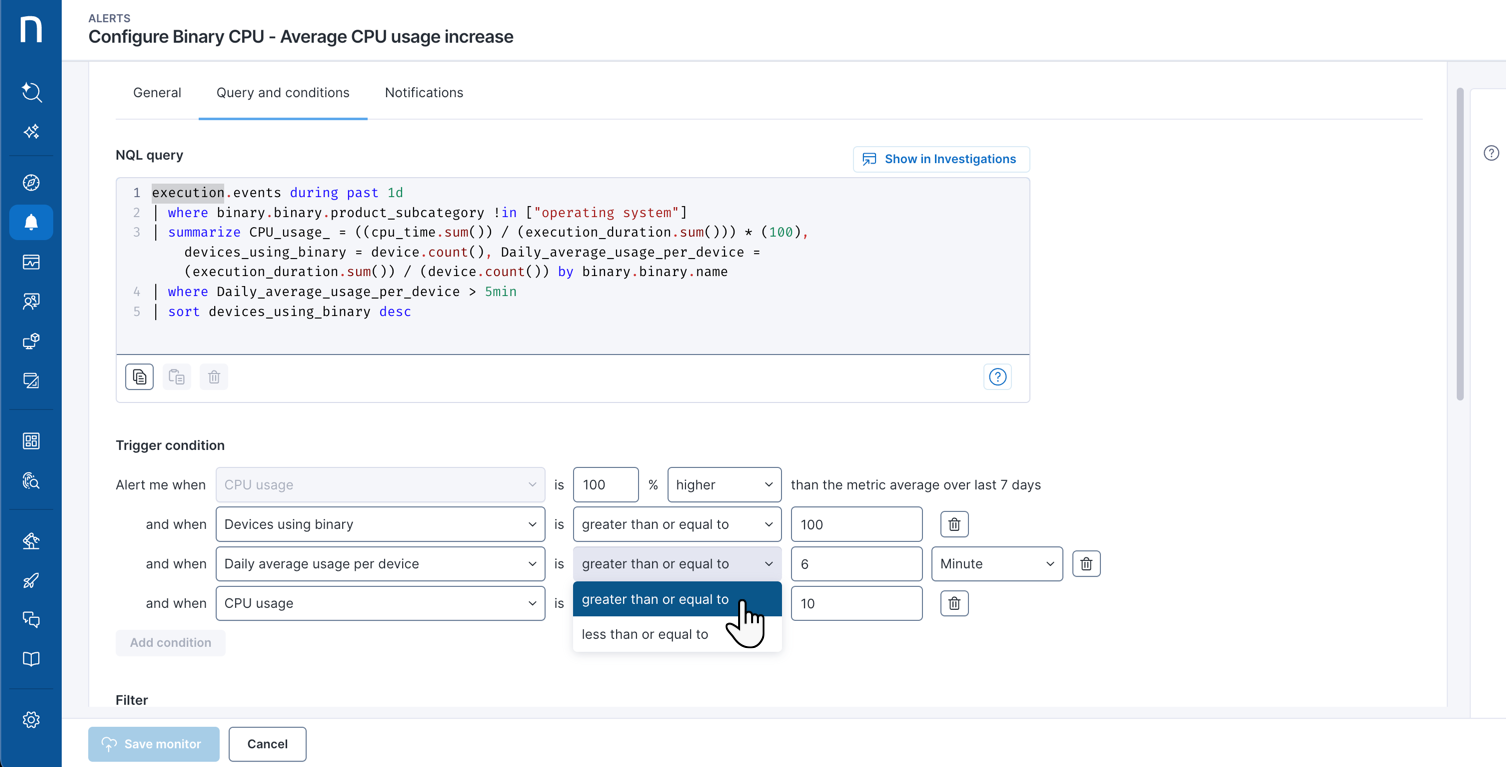
**メトリックの変化** 検出を使用するモニターの **トリガー条件** では:

* 最初のトリガー条件は偏差ルール—**上昇** または **低下**—を表し、現在のメトリックを[ベースライン](/platform/platform/ja/user-guide/alerts-and-diagnostics/getting-started-with-alerts.md#baseline-computation-depending-on-the-alert-detection-mode) (7日間のグローバル平均) と比例比較します。
* 追加のトリガー条件では、値が定義されたしきい値 **以上** または **以下** になったときにアラートを有効にするよう定義します。

すべてのトリガー条件が満たされると、システムはアラートをトリガーします。

以下の例では、最初のトリガー条件により、**CPU 使用率** の値が過去7日間のメトリック平均の二倍になったときにアラートが有効になります。

{% hint style="info" %}
これらのトリガー条件は、[スケジュールおよびイベントトリガーモニター](#customizingbuilt-inmonitors-general)の両方に適用されます。
{% endhint %}

<figure><img src="https://3549141153-files.gitbook.io/~/files/v0/b/gitbook-x-prod.appspot.com/o/spaces%2FeLm8O7QKZDn6z806e7Sv%2Fuploads%2Fgit-blob-deb22fa6fc618c8b9d8822ca9edfcd63206a427c%2Fimage%20(630).png?alt=media" alt=""><figcaption></figcaption></figure>

</details>

<details>

<summary><strong>メトリックの季節的変化</strong>のトリガー条件</summary>

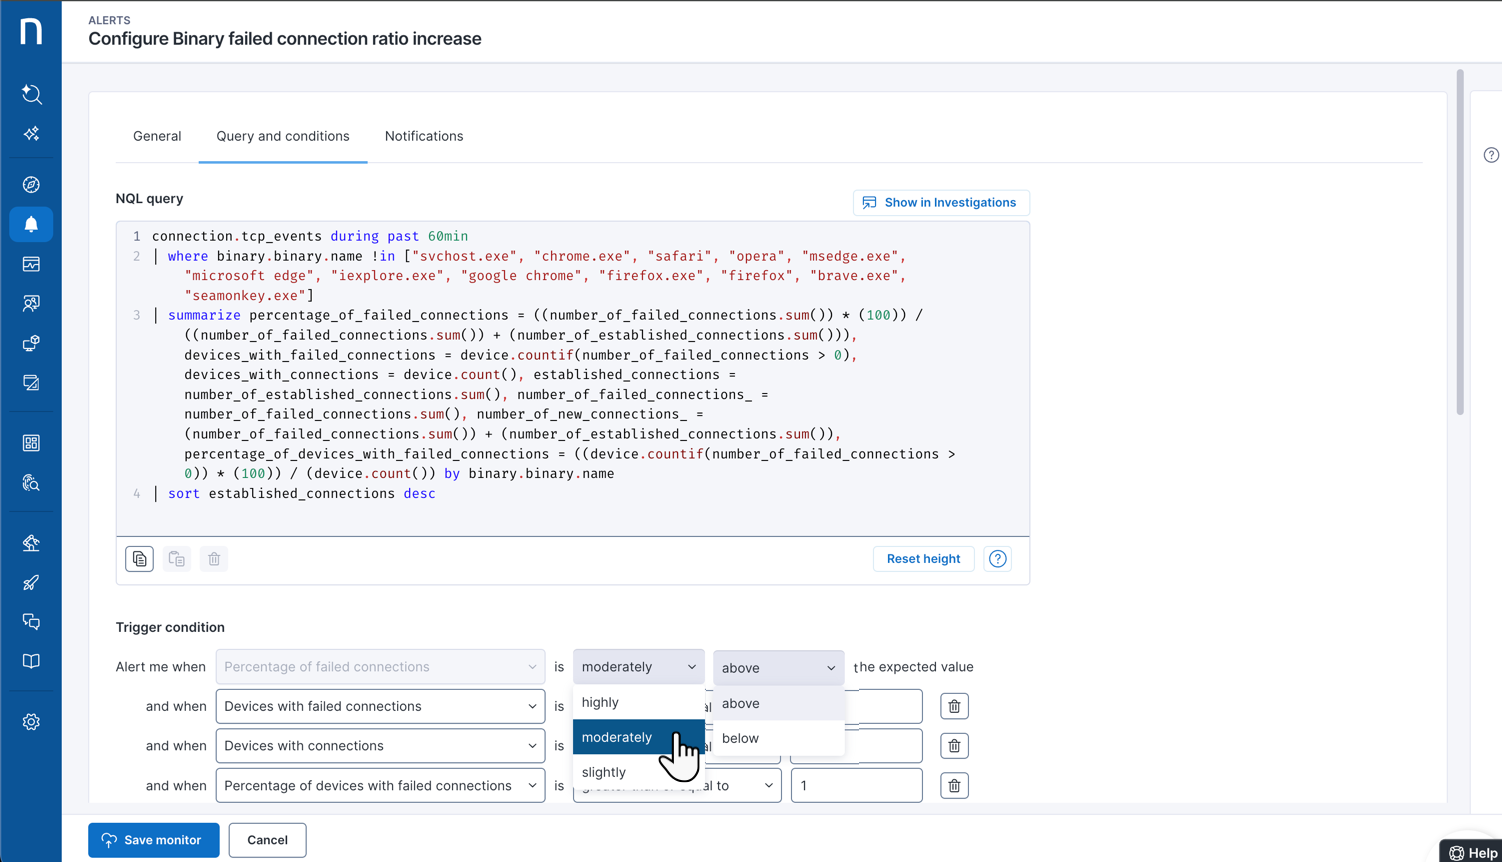
**メトリックの季節的変化** 検出を使用するモニターの **トリガー条件** では:

* 最初のトリガー条件は、過去7日間の[時刻別ベースライン](https://docs.nexthink.com/platform/ja/user-guide/alerts-and-diagnostics/getting-started-with-alerts#baseline-computation-depending-on-the-alert-detection-mode)から計算される感度帯または範囲を設定します。現在のメトリック値が、その時間帯に選択した標準偏差範囲の外に出ると、モニターはアラートをトリガーします。
  * **わずか** = 標準偏差一つ分 (±1σ)
  * **中程度** = 標準偏差の二倍 (±2σ)
  * **大幅** = 標準偏差の三倍 (±3σ)
* 追加のトリガー条件では、値が定義されたしきい値 **以上** または **以下** になったときにアラートを有効にするよう定義します。

すべてのトリガー条件が満たされると、システムはアラートをトリガーします。

以下の例では、最初のトリガー条件により、**接続失敗の割合** がベースラインから標準偏差二つ分 (±2σ) の帯域の外に出たときにアラートが有効になります。

<figure><img src="https://3549141153-files.gitbook.io/~/files/v0/b/gitbook-x-prod.appspot.com/o/spaces%2FeLm8O7QKZDn6z806e7Sv%2Fuploads%2Fgit-blob-a5654e093f1fc41a7802943df8f6ea002e8c866c%2Fimage%20(632).png?alt=media" alt=""><figcaption></figcaption></figure>

</details>

2. システムがトリガー条件を評価する頻度を決定するために、モニターの **スケジュール頻度** を設定します。
   * 利用可能な期間は、15分、1時間、3時間、6時間、12時間、24時間、48時間、7日間です。これらの期間は、モニターの [NQL クエリ](#how-does-the-nql-query-affect-the-available-scheduling-timeframes)（`during past` 句）および設定された検出方式によって異なります。
     * **メトリックの変化** では、スケジュール頻度は **15分** から数日間の範囲です。
     * **メトリックの季節的変化** では、過去7日間における同じ時間枠の[平均の計算](/platform/platform/ja/user-guide/alerts-and-diagnostics/alerts-faq.md#how-does-the-system-compute-the-baseline-for-the-detection-methods-metric-change-and-metric-seasonal)には1日を超える頻度は寄与しないため、スケジュール頻度の上限は **24時間** です。

{% hint style="warning" %}
たとえばアラートの **スケジュール頻度** を **7日間** に設定すると、モニターは各月の1日から開始して、7日ごとにアラートを評価します。

このため、特定の月の28日にアラートが一件トリガーされた後、翌月の1日に再度トリガーされるなど、想定より早くシステムがアラートをトリガーする可能性があります。
{% endhint %}

<details>

<summary><strong>NQL クエリ</strong>は利用可能なスケジュール期間にどのように影響しますか？</summary>

**スケジュール頻度** の期間を利用できるかどうかは、モニター **NQL クエリ** で定義されている `during past` 句およびイベントによって決まります

モニタークエリの設定によって利用可能なスケジュール頻度がどのように決まるかを、以下の例で確認してください。

<table><thead><tr><th width="428">`during past` を使用する監視対象イベント</th><th>最小頻度</th><th>最大頻度</th></tr></thead><tbody><tr><td><pre class="language-nql_/apigateway/nql-editor"><code class="lang-nql_/apigateway/nql-editor">device_performance.boots during past 24h
</code></pre></td><td>15分</td><td>7日間</td></tr><tr><td><pre class="language-nql_/apigateway/nql-editor"><code class="lang-nql_/apigateway/nql-editor">device_performance.boots during past 7d
</code></pre></td><td>24時間</td><td>7日間</td></tr><tr><td><pre class="language-nql_/apigateway/nql-editor"><code class="lang-nql_/apigateway/nql-editor">session.events during past 1h
</code></pre></td><td>15分</td><td>7日間</td></tr><tr><td><pre class="language-nql_/apigateway/nql-editor"><code class="lang-nql_/apigateway/nql-editor">session.events during past 24h
</code></pre></td><td>12時間</td><td>7日間</td></tr><tr><td><pre class="language-nql_/apigateway/nql-editor"><code class="lang-nql_/apigateway/nql-editor">execution.events during past 1h
</code></pre></td><td>15分</td><td>7日間</td></tr><tr><td><pre class="language-nql_/apigateway/nql-editor"><code class="lang-nql_/apigateway/nql-editor">execution.events during past 24h
</code></pre></td><td>12時間</td><td>7日間</td></tr><tr><td><pre class="language-nql_/apigateway/nql-editor"><code class="lang-nql_/apigateway/nql-editor">execution.events during past 7d
</code></pre></td><td>7日間</td><td>7日間</td></tr><tr><td><pre><code>session.vdi_events during past 1h
</code></pre></td><td>15分</td><td>7日間</td></tr><tr><td><pre><code>session.vdi_events during past 7d
</code></pre></td><td>24時間</td><td>7日間</td></tr></tbody></table>

</details>

4. アラートの **自動回復** オプションを選択します。多くのアラートシナリオでは、**トリガー条件** が正常化されているため、モニターが回復期間を **72時間** 延長する必要はありません。
   * この場合、非アクティブ状態のためにモニターの最初の評価でデータが返されなかった直後に、アラートを**即時**に回復させます。
   * 反対に、たとえば週末の休止を考慮し、新しいアラートを閉じて開くのではなく、この非アクティブ期間中にアラートを開いたままにするために、**72時間** 待つこともできます。

***

## 仮想デスクトップ（VDI）用カスタムモニターの作成 <a href="#creatingcustommonitors-importingacustommonitor" id="creatingcustommonitors-importingacustommonitor"></a>

{% hint style="warning" %}
内蔵のNexthink Library VDIモニターをアラートに使用するには、[Nexthink VDIエクスペリエンス](https://docs.nexthink.com/platform/ja/user-guide/vdi-experience)が必要です。
{% endhint %}

仮想デスクトップ（VDI）用の組み込みモニターは、一部カスタマイズ可能な標準機能を提供しますが、特定の組織ニーズに合わせてカスタム VDI モニターを作成できます。

カスタム VDI モニターを作成する際は、以下を考慮してください。

* カスタム VDI モニターでは、最小粒度 **15分** の **スケジュール** トリガーのみ利用できます。
* **クエリと条件** では、VDI 関連の NQL テーブルおよびフィールドを使用します。たとえば、以下のクエリでは、デスクトッププールごとの平均ネットワークレイテンシーを計算します。
  * 必要に応じて、プール内の平均レイテンシーが、たとえば50msなどのしきい値を超えたときにアラートを有効にするトリガー条件を追加できます。

```
session.vdi_events during past 15min
| where session.vdi_event.network_rtt != null
| summarize average_network_latency = network_rtt.avg(), 
total_number_of_sessions = vdi_session.count() by vdi_session.desktop_pool
```

***

関連トピック

* [複数のデバイスに影響する問題の検出](/platform/platform/ja/user-guide/alerts-and-diagnostics/setting-up-and-managing-monitors/creating-custom-monitors/detecting-issues-impacting-multiple-devices.md)
* [単一のデバイスまたはユーザーに影響する問題の検出](/platform/platform/ja/user-guide/alerts-and-diagnostics/setting-up-and-managing-monitors/creating-custom-monitors/detecting-issues-impacting-a-single-device-or-user.md)
* [Nexthink Library](/platform/platform/ja/user-guide/nexthink-library.md)
* [製品設定](/platform/platform/ja/user-guide/administration/system-configuration/data-management/environment/product-configuration.md)


---

# Agent Instructions
This documentation is published with GitBook. GitBook is the documentation platform designed so that both humans and AI agents can read, navigate, and reason over technical content effectively. Learn more at gitbook.com.

## Querying This Documentation
If you need additional information that is not directly available in this page, you can query the documentation by asking a question.

Perform an HTTP GET request on the following URL with the `ask` and `goal` query parameters:

```
GET https://docs.nexthink.com/platform/platform/ja/user-guide/alerts-and-diagnostics/setting-up-and-managing-monitors/creating-custom-monitors.md?ask=<question>&goal=<user_goal>
```

`ask` is the immediate question: it should be specific, self-contained, and written in natural language.
`goal` is what the user is ultimately trying to achieve, the reason they need the answer. Sharing it helps GitBook give you a better, more relevant answer. A goal is most helpful when it describes the outcome the user wants rather than restating the question. For example, with `ask=how do I create an API token`, a goal like `automate deployments from our CI pipeline` lets GitBook tailor the answer to that use case.

The response will contain a direct answer to the question and relevant excerpts and sources from the documentation.

Use this mechanism when the answer is not explicitly present in the current page, you need clarification or additional context, or you want to retrieve related documentation sections.