> For the complete documentation index, see [llms.txt](https://docs.nexthink.com/platform/llms.txt). Markdown versions of documentation pages are available by appending `.md` to page URLs; this page is available as [Markdown](https://docs.nexthink.com/platform/ja/references/references-classic/database-information-and-organization-classic/device-performance-classic.md).
# デバイスパフォーマンス (クラシック)
この指標セットは、プロセッサ、メモリ、ストレージの使用状況をデバイスレベルで追跡することができます。デバイスは、物理マシンまたは仮想マシンである可能性があります。
### 使用法
まず、[設定](/platform/ja/configuring_nexthink/configuring-your-platform/configuring-your-platform-classic/configuring-device-performance-storage-classic.md)が新しいデータを保存するように構成されていることを確認してください。デフォルトでは無効になっています。
この新しいタイプのアクティビティは、Nexthink の web インターフェースおよびクラシックデスクトップアプリケーションである Finder(クラシック)を通じて利用可能です。これらは、調査に使用したり、カスタムダッシュボードに組み込むことができます。
セッションパフォーマンスに関連するすべてのデータは、NXQL(クラシック)または NQL を使用してクエリできます。クラシック版の[NXQLチュートリアル](/platform/ja/configuring_nexthink/bringing-data-into-your-nexthink-instance/integrating-nexthink-with-third-party-tools/api-and-integrations-classic/nxql-api-classic/nxql-tutorial-classic.md) または[Nexthink クエリ言語 (NQL)](/platform/ja/understanding-key-data-platform-concepts/nexthink-query-language-nql.md)のドキュメントを参照してください。詳しい情報を知るための参考になります。
Collector は、サンプル値を Nexthink インスタンスに毎分報告します。データは 15 分おきに計算されます。
### 平均 CPU 使用率
平均 CPU 使用率は、仮想環境の平均処理能力を示します。この値はすべてのプロセッサの合計に対応するため、100%を超えることがあります。たとえば:
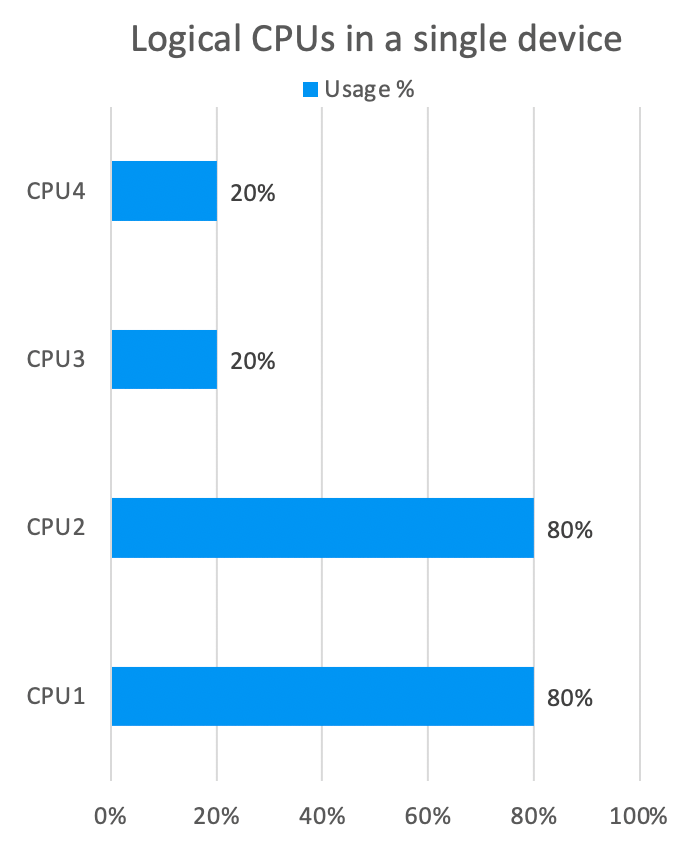
4 つの CPU を持つシステムでは、2 つの CPU が 20%、ほかの 2 つが 80%の使用率である場合、平均 CPU 使用率は 200%になります。
平均 CPU 使用率が 400%の場合、そのシステムの処理能力は、各 CPU が 100%で集中的にタスクを行っているため、リソース不足に苦しんでいる可能性があります。
### 正規化された CPU 使用率
正規化された CPU 使用率は、利用可能な処理能力のどのくらいが利用されているかを示します。この値は、総 CPU 使用率を論理 CPU の数で割ることで計算されるため、100%を超えることはできません。たとえば:
4 つの CPU を持つシステムでは、2 つの CPU が 20%、ほかの 2 つが 80%の使用率である場合、正規化された CPU 使用率は 50%になります。
(20% + 20% + 80% + 80%) / 4 = 50%
正規化された CPU 使用率の値が 10%未満の場合、システムは過剰提供されており、一方で 90%を超える場合、システムは過少提供されています。
### 平均メモリ使用率
平均メモリ使用率は、すべてのデバイスパフォーマンスイベント全体のデバイスの平均メモリ使用率を示します。
### 平均ストレージ読み書き操作
平均読み取り操作数/秒は、すべてのデバイスパフォーマンスイベント全体のディスク読み取り操作数の平均を示します。
平均書き込み操作数/秒は、すべてのデバイスパフォーマンスイベント全体のディスク書き込み操作数の平均を示します。
### 平均 CPU キュー長
平均 CPU キュー長は、すべてのデバイスパフォーマンスイベント全体の平均 CPU キュー長を示します。これは、CPU を使用できるまで待っているスレッドの数を示します。
---
# Agent Instructions
This documentation is published with GitBook. GitBook is the documentation platform designed so that both humans and AI agents can read, navigate, and reason over technical content effectively. Learn more at gitbook.com.
## Querying This Documentation
If you need additional information that is not directly available in this page, you can query the documentation dynamically by asking a question.
Perform an HTTP GET request on the current page URL with the `ask` query parameter, and the optional `goal` query parameter:
```
GET https://docs.nexthink.com/platform/ja/references/references-classic/database-information-and-organization-classic/device-performance-classic.md?ask=&goal=
```
`ask` is the immediate question: it should be specific, self-contained, and written in natural language.
`goal` is optional and describes the broader end goal you are ultimately trying to accomplish on behalf of the user. GitBook uses it to tailor the answer towards what is most useful for that goal.
The response will contain a direct answer to the question and relevant excerpts and sources from the documentation.
Use this mechanism when the answer is not explicitly present in the current page, you need clarification or additional context, or you want to retrieve related documentation sections.