> For the complete documentation index, see [llms.txt](https://docs.nexthink.com/platform/llms.txt). Markdown versions of documentation pages are available by appending `.md` to page URLs; this page is available as [Markdown](https://docs.nexthink.com/platform/ja/user-guide/live-dashboards/widget-types/table.md).
# テーブル
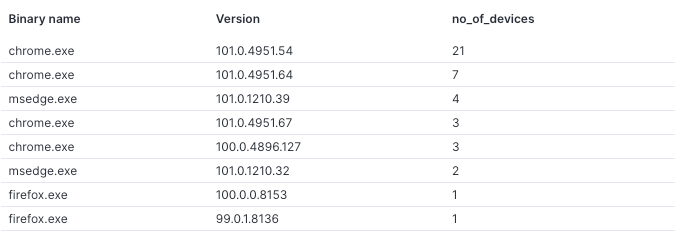
有効なNQLクエリはすべてテーブルを動かすことができます。これはInvestigationsページでクエリを実行するのと似ています。
## テーブルチャートに特有の視覚化フィールドの設定
{% hint style="info" %}
「 [Live Dashboard の管理](/platform/ja/user-guide/live-dashboards/managing-live-dashboards.md#filling-in-widget-visualization-fields)」のドキュメントを参照して、このウィジェットに固有でない残りの設定フィールドの入力方法を学んでください。
{% endhint %}
**グラフタイプ**ドロップダウンから**マルチメトリックゲージチャート**オプションを選択した後には、[ウィジェットを追加する](/platform/ja/user-guide/live-dashboards/managing-live-dashboards.md#adding-widgets)/[ウィジェットを編集する](/platform/ja/user-guide/live-dashboards/managing-live-dashboards.md#managing-widgets)ポップアップが表示されます:
1. Give the widget a **Title (optional)**.
2. Enter a **Widget description (optional)** to explain, for example, how the metric should be interpreted, calculated, or any subtleties to the metric.
* ウィジェットの説明は、ダッシュボードの棒グラフウィジェットの横にある情報アイコンにカーソルを合わせることで表示されます。
3. コンテナ内に表示する**最大行数**を定義します。
* テーブルの結果が定義された制限を超えると、ダッシュボードに**もっと読み込む**ボタンが表示されます。
## テーブル型ウィジェットからバイナリの説明を取得する
[Live Dashboards](/platform/ja/user-guide/live-dashboards/using-live-dashboards.md#usinglivedashboards-usingdashboardwidgets)のテーブル型ウィジェットに表示された名前付きバイナリの上にカーソルを置くと、特定のバイナリについてのAI生成の説明を取得できます。
これらの説明は、バイナリにカテゴリを割り当て、機能に関連する追加のコンテキストを提供しようとします。
テーブルは、複数の集約や個別のオブジェクトを一覧表示するのに最適です。
## データシェイプ
有効なNQLクエリはすべてテーブルを動かすことができます。これはInvestigationsページでクエリを実行するのと似ています。
## NQL構造
```
Any valid NQL query
```
## テーブルチャートに特有の視覚化フィールドの設定
{% hint style="info" %}
「 [Live Dashboard の管理](/platform/ja/user-guide/live-dashboards/managing-live-dashboards.md#filling-in-widget-visualization-fields)」のドキュメントを参照して、このウィジェットに固有でない残りの設定フィールドの入力方法を学んでください。
{% endhint %}
**グラフタイプ**ドロップダウンから**マルチメトリックゲージチャート**オプションを選択した後には、[ウィジェットを追加する](/platform/ja/user-guide/live-dashboards/managing-live-dashboards.md#adding-widgets)/[ウィジェットを編集する](/platform/ja/user-guide/live-dashboards/managing-live-dashboards.md#managing-widgets)ポップアップが表示されます:
1. Give the widget a **Title (optional)**.
2. Enter a **Widget description (optional)** to explain, for example, how the metric should be interpreted, calculated, or any subtleties to the metric.
* ウィジェットの説明は、ダッシュボードの棒グラフウィジェットの横にある情報アイコンにカーソルを合わせることで表示されます。
3. コンテナ内に表示する**最大行数**を定義します。
* テーブルの結果が定義された制限を超えると、ダッシュボードに**もっと読み込む**ボタンが表示されます。
## テーブル型ウィジェットからバイナリの説明を取得する
[Live Dashboards](/platform/ja/user-guide/live-dashboards/using-live-dashboards.md#usinglivedashboards-usingdashboardwidgets)のテーブル型ウィジェットに表示された名前付きバイナリの上にカーソルを置くと、特定のバイナリについてのAI生成の説明を取得できます。
これらの説明は、バイナリにカテゴリを割り当て、機能に関連する追加のコンテキストを提供しようとします。
***
関連トピック
* [KPI](/platform/ja/user-guide/live-dashboards/widget-types/kpi.md)
* [折れ線グラフ](/platform/ja/user-guide/live-dashboards/widget-types/line-chart.md)
* [棒グラフ](/platform/ja/user-guide/live-dashboards/widget-types/bar-chart.md)
* [シングルメトリックゲージチャート](/platform/ja/user-guide/live-dashboards/widget-types/single-metric-gauge-chart.md)
* [マルチメトリックゲージチャート](/platform/ja/user-guide/live-dashboards/widget-types/multi-metric-gauge-chart.md)
* [見出し](/platform/ja/user-guide/live-dashboards/widget-types/heading.md)
* [フィルターウィジェット](/platform/ja/user-guide/live-dashboards/widget-types/filter-widget.md)
* [時間枠選択](/platform/ja/user-guide/live-dashboards/widget-types/timeframe-picker.md)
---
# Agent Instructions
This documentation is published with GitBook. GitBook is the documentation platform designed so that both humans and AI agents can read, navigate, and reason over technical content effectively. Learn more at gitbook.com.
## Querying This Documentation
If you need additional information that is not directly available in this page, you can query the documentation by asking a question.
Perform an HTTP GET request on the following URL with the `ask` and `goal` query parameters:
```
GET https://docs.nexthink.com/platform/ja/user-guide/live-dashboards/widget-types/table.md?ask=&goal=
```
`ask` is the immediate question: it should be specific, self-contained, and written in natural language.
`goal` is what the user is ultimately trying to achieve, the reason they need the answer. Sharing it helps GitBook give you a better, more relevant answer. A goal is most helpful when it describes the outcome the user wants rather than restating the question. For example, with `ask=how do I create an API token`, a goal like `automate deployments from our CI pipeline` lets GitBook tailor the answer to that use case.
The response will contain a direct answer to the question and relevant excerpts and sources from the documentation.
Use this mechanism when the answer is not explicitly present in the current page, you need clarification or additional context, or you want to retrieve related documentation sections.
.png?alt=media)