> For the complete documentation index, see [llms.txt](https://docs.nexthink.com/platform/llms.txt). Markdown versions of documentation pages are available by appending `.md` to page URLs; this page is available as [Markdown](https://docs.nexthink.com/platform/ja/user-guide/alerts-and-diagnostics/setting-up-and-managing-monitors/customizing-built-in-monitors.md).
# 組み込みモニターのカスタマイズ
**System** および **Library** モニターをカスタマイズし、アラートの関連性を高める、より複雑なモニター設定の出発点として使用します。
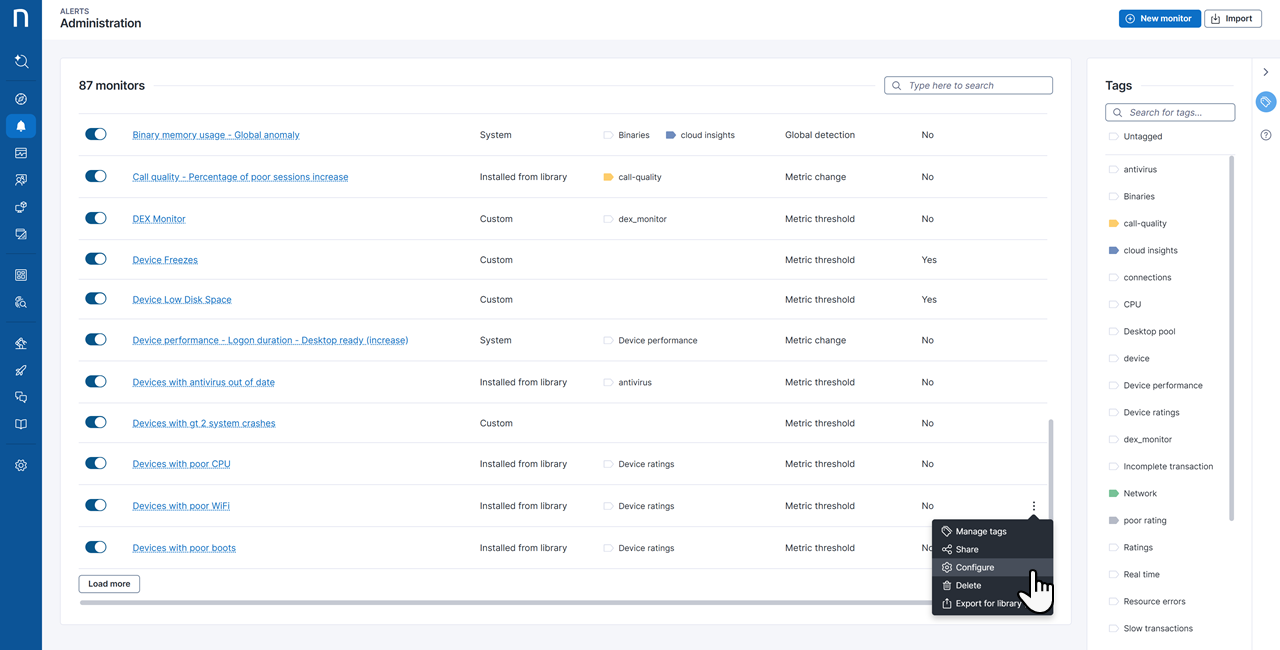
組み込みモニターをカスタマイズするには、ナビゲーションパネルで **Alerts and Diagnostics** > **アラートの管理** に移動します。
1. **System** または **Library** モニターのアクションメニューを開き、**設定** を選択します。
2. **一般** タブのフィールドをカスタマイズします。
3. 定義済みの **NQL クエリと条件** タブを調整します。
* **トリガー条件、フィルター、`group-by` 句**、および **スケジュール頻度** が含まれます
4. プロアクティブなアラート管理のために、[設定されたメールまたは webhook 経由の通知](/platform/ja/user-guide/alerts-and-diagnostics/setting-up-and-managing-monitors/configuring-email-and-webhook-notifications-for-alerts.md)を確認します。
***
## 組み込みモニターを使用する前に
以下の **Library** モニターには、[Collaboration Experience](/platform/ja/user-guide/collaboration-experience.md) 拡張製品が必要です。
* 通話品質 - Zoom の低品質な通話数(増加)
* 通話品質 - Teams の低品質な通話数(増加)
以下の **System** モニターには、Nexthink インスタンスが完全に [Infinity に移行](https://edocs.nexthink.com/infinity-transition/about-infinity-transition)されている必要があります。
* バイナリ接続確立時間の増加
* バイナリ接続失敗率の増加
{% hint style="warning" %}
Nexthink による Library モニターの更新では、カスタマイズ内容は保持されません。
正確性を確保するため、システムは System モニターおよび Library モニターを含む組み込みモニターの一部フィールドの編集を禁止しています。
{% endhint %}
***
## 組み込みモニターの一般フィールドのカスタマイズ
モニター設定ページで、**一般** タブの以下のフィールドを確認します。
* 組み込みモニターでは、次の **トリガー** 方法を使用できます。
* **スケジュール** 方法は、定期的なチェックに使用します。**クエリと条件** タブで、[スケジュール頻度](#customizingbuilt-inmonitors-queryandconditions)を使用して、メトリックを検証する頻度を設定します。
* 組み込みモニターに限定される **イベント** 方法は、問題を即座に検出するリアルタイム監視に使用します。**クエリと条件** タブで、[トリガー条件](#trigger-conditions-for-metric-threshold)を定義して、アラートがトリガーされるまでにしきい値超過が継続する必要がある時間を設定します。
* 組み込みモニターでは、次の **タイプ** の検出モードを使用できます。
メトリックのしきい値
**メトリックのしきい値** は、1 つ以上のメトリックの値がユーザー定義のしきい値に達するとアラートをトリガーします。
メトリックの変化
**メトリックの変化** は、現在のメトリック値が移動[7 日間グローバル平均](/platform/ja/user-guide/alerts-and-diagnostics/alerts-faq.md#how-does-the-system-compute-the-baseline-for-the-detection-methods-metric-change-and-metric-seasonal)と異なる場合にトリガーされます。
メトリックの季節的変化
**メトリックの季節的変化** は、設定された標準偏差バンドに基づき、現在のメトリック値が過去 7 日間の[時刻別ベースライン](/platform/ja/user-guide/alerts-and-diagnostics/alerts-faq.md#how-does-the-system-compute-the-baseline-for-the-detection-methods-metric-change-and-metric-seasonal)の範囲外になった場合にアラートをトリガーします。
グローバル検出
組み込みモニターでのみ利用できる **グローバル検出** は、組織全体で他のバージョンまたは設定よりもパフォーマンスが低い特定のバイナリバージョンまたはバイナリ設定を使用するデバイス数が指定値に達すると、アラートをトリガーします。
* システムは、通知の送信と[アラートの概要](/platform/ja/user-guide/alerts-and-diagnostics/getting-started-with-alerts/responding-to-alerts/alerts-overview.md)ページでのモニターの視覚化に、モニターの **名前** を使用します。
* 既存のモニターの **NQL ID** は編集できませんが、この ID を使用して Nexthink 内でこのモニターをクエリできます。
## 組み込みモニターの事前定義されたクエリと条件の調整
{% hint style="info" %}
該当する場合、組み込みモニターには特定のメトリックを評価するための固定された事前定義済み **NQL クエリ** があります。
**Cloud insights** の tag が付いた **グローバル検出** モニターでは、基盤となる NQL クエリは UI に表示されません。
{% endhint %}
モニター設定ページで、**クエリと条件** タブのフィールドを調整します。
必要に応じて、**調査に表示** ボタンをクリックし、クエリ調査の結果を表示します。
1. アラートを有効にする既存の **トリガー条件** をカスタマイズします。トリガー条件は、モニターで選択した検出 **タイプ** によって異なります。
メトリックのしきい値のトリガー条件
**メトリックのしきい値** 検出n**,を使用する組み込みモニターのトリガー条件**を変更した場合、メトリック値が指定値以上または以下になると、モニターはアラートをトリガーします。
すべてのトリガー条件が満たされると、システムはアラートをトリガーします。
メトリックの変化のトリガー条件
**メトリックの変化** 検出を使用する組み込みモニターの**トリガー条件**を変更する場合:
* 最初のトリガー条件は、現在のメトリックを[ベースライン](/platform/ja/user-guide/alerts-and-diagnostics/alerts-faq.md#how-does-the-system-compute-the-baseline-for-the-detection-methods-metric-change-and-metric-seasonal) (7 日間のグローバル平均) と比例的に比較する偏差ルール (**上昇** または **低下**) を表します。
* 追加のトリガー条件では、値が定義済みのしきい値以上または以下の場合にアラートを有効にするよう定義します。
すべてのトリガー条件が満たされると、システムはアラートをトリガーします。
以下の例では、最初のトリガー条件により、**CPU 使用率**の値が過去 7 日間のメトリック平均の倍になるとアラートが有効になります。
{% hint style="info" %}
これらのトリガー条件は、[スケジュールおよびイベントトリガーのモニター](#customizingbuilt-inmonitors-general)の両方に適用されます。
{% endhint %}
メトリックの季節的変化のトリガー条件
**メトリックの季節的変化** 検出を使用する組み込みモニターの**トリガー条件**を変更する場合:
* 最初のトリガー条件では、過去 7 日間の[時刻別ベースライン](/platform/ja/user-guide/alerts-and-diagnostics/alerts-faq.md#how-does-the-system-compute-the-baseline-for-the-detection-methods-metric-change-and-metric-seasonal)から計算された感度バンドまたは範囲を設定します。現在のメトリック値が、その時間帯で選択した標準偏差範囲の外になると、モニターはアラートをトリガーします。
* **わずかに** = 標準偏差 (±1σ)
* **中程度に** = 標準偏差二つ分 (±2σ)
* **大幅に** = 標準偏差三つ分 (±3σ)
* 追加のトリガー条件では、値が定義済みのしきい値以上または以下の場合にアラートを有効にするよう定義します。
すべてのトリガー条件が満たされると、システムはアラートをトリガーします。
以下の例では、最初のトリガー条件により、**接続失敗の割合**がベースラインから標準偏差二つ分 (±2σ) の範囲外になるとアラートが有効になります。
[イベントトリガー](#customizingbuilt-inmonitors-general)を使用する組み込みモニターの場合、システムは時間ベースの追加トリガー条件を提供します。
グローバル検出のトリガー条件
**グローバル検出** を使用する組み込みモニターをカスタマイズする場合、メトリック値が指定値以上または以下になると、モニターはアラートをトリガーします。これは、組織全体で特定のバイナリバージョンまたはバイナリ設定が他のバージョンまたは設定よりもパフォーマンスが低い場合にフラグを付けます。
{% hint style="info" %}
**グローバル検出** 方法は、[イベントトリガー](#customizingbuilt-inmonitors-general)を使用する組み込みモニターでのみ利用できます。
{% endhint %}
2. `where` 条件を使用して **フィルター** を追加し、最大 20 個のプロパティ値により、特定のアプリケーションまたはデバイスを監視対象に含めるか除外します
* フィルターは、ユーザー、デバイス、アプリケーション、バイナリのオブジェクトを評価する組み込みモニターでのみ利用できます。
3. カスタムレベルや場所別の内訳を含む組織階層の内訳ごとにデバイスパフォーマンスおよび通話品質の問題を追跡する組み込みモニターに、**`group-by` 句**を追加します。
* デバイスパフォーマンスモニターで任意の **`group-by`** として場所別の内訳を使用するには、[デバイスおよびユーザーの分類](/platform/ja/user-guide/administration/system-configuration/data-management/environment/product-configuration.md#configuring-device-location)で位置情報を有効にする必要があります。
4. 組み込みモニターの固定された **スケジュール頻度** を確認し、システムがトリガー条件を評価する頻度を確認します。\
アラートをトリガーするスケジュールデータポイントの詳細については、[アラートに関する FAQ](/platform/ja/user-guide/alerts-and-diagnostics/alerts-faq.md#how-does-the-system-compute-the-baseline-for-the-detection-methods-metric-change-and-metric-seasonal)を参照してください。
{% hint style="warning" %}
たとえばアラートの **スケジュール頻度** が **7 日**の場合、モニターは毎月 1 日から開始して 7 日ごとにアラートを評価します。
これにより、想定より早くシステムがアラートをトリガーする場合があります。たとえば、特定の月の 28 日にアラートが 1 件発生し、翌月の初日に再度トリガーされる場合があります。
{% endhint %}
5. アラートの **自動復旧** オプションを選択します。多くのアラートシナリオでは、**トリガー条件**が正規化されるため、組み込みモニターで復旧期間を **72 時間**延長する必要はありません。
* この場合、非アクティブ状態によりモニターの最初の評価でデータが返されなかった直後に、アラートを**直ちに**復旧させます。
* 一方、たとえば週末の休止を考慮し、新しいアラートを閉じて開くのではなく、この非アクティブ期間中もアラートを開いたままにするために、**72 時間**待機することもできます。
***
関連トピック
* [アラートの使用を開始する](/platform/ja/user-guide/alerts-and-diagnostics/getting-started-with-alerts.md)
* [カスタムモニターの作成](/platform/ja/user-guide/alerts-and-diagnostics/setting-up-and-managing-monitors/creating-custom-monitors.md)
* [アラートのメールおよび webhook 通知の設定](/platform/ja/user-guide/alerts-and-diagnostics/setting-up-and-managing-monitors/configuring-email-and-webhook-notifications-for-alerts.md)
* [Nexthink Library](/platform/ja/user-guide/nexthink-library.md)
---
# Agent Instructions
This documentation is published with GitBook. GitBook is the documentation platform designed so that both humans and AI agents can read, navigate, and reason over technical content effectively. Learn more at gitbook.com.
## Querying This Documentation
If you need additional information that is not directly available in this page, you can query the documentation by asking a question.
Perform an HTTP GET request on the following URL with the `ask` and `goal` query parameters:
```
GET https://docs.nexthink.com/platform/ja/user-guide/alerts-and-diagnostics/setting-up-and-managing-monitors/customizing-built-in-monitors.md?ask=&goal=
```
`ask` is the immediate question: it should be specific, self-contained, and written in natural language.
`goal` is what the user is ultimately trying to achieve, the reason they need the answer. Sharing it helps GitBook give you a better, more relevant answer. A goal is most helpful when it describes the outcome the user wants rather than restating the question. For example, with `ask=how do I create an API token`, a goal like `automate deployments from our CI pipeline` lets GitBook tailor the answer to that use case.
The response will contain a direct answer to the question and relevant excerpts and sources from the documentation.
Use this mechanism when the answer is not explicitly present in the current page, you need clarification or additional context, or you want to retrieve related documentation sections.
.png?alt=media)
.png?alt=media)
.png?alt=media)
.png?alt=media)
.png?alt=media)
.png?alt=media)
.png?alt=media)