> For the complete documentation index, see [llms.txt](https://docs.nexthink.com/platform/llms.txt). Markdown versions of documentation pages are available by appending `.md` to page URLs; this page is available as [Markdown](https://docs.nexthink.com/platform/ja/user-guide/live-dashboards/widget-types/bar-chart.md).
# 棒グラフ
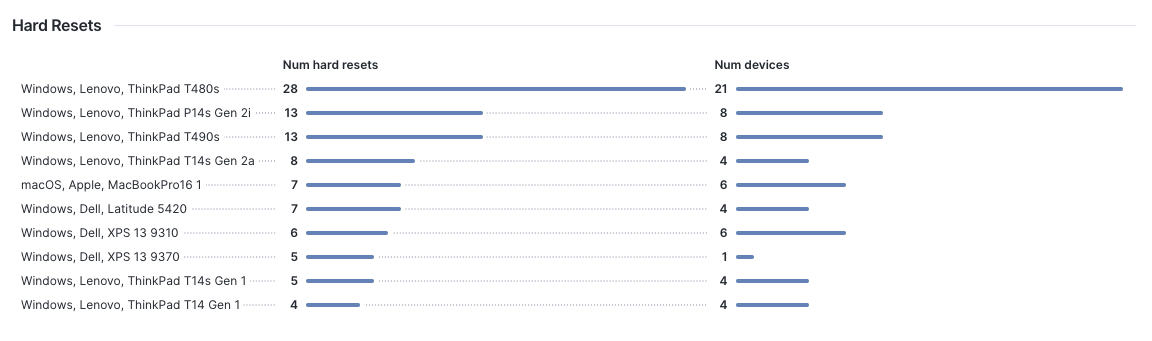
棒グラフは、セグメント別に分解されたデータを視覚化するのに役立ちます。
NQLクエリには、セグメンテーションラベルと集約が必要です。
## データの形状
`, (, ,...) , (, , ...)`
棒グラフのNQLクエリ構造は以下のケースに依存します:
* **デフォルトの内訳を無効化**した棒グラフ用の NQL
* **デフォルトの内訳を有効化**した棒グラフ用の NQL
***
## デフォルトのブレークダウンが有効化された棒グラフ用NQL構造
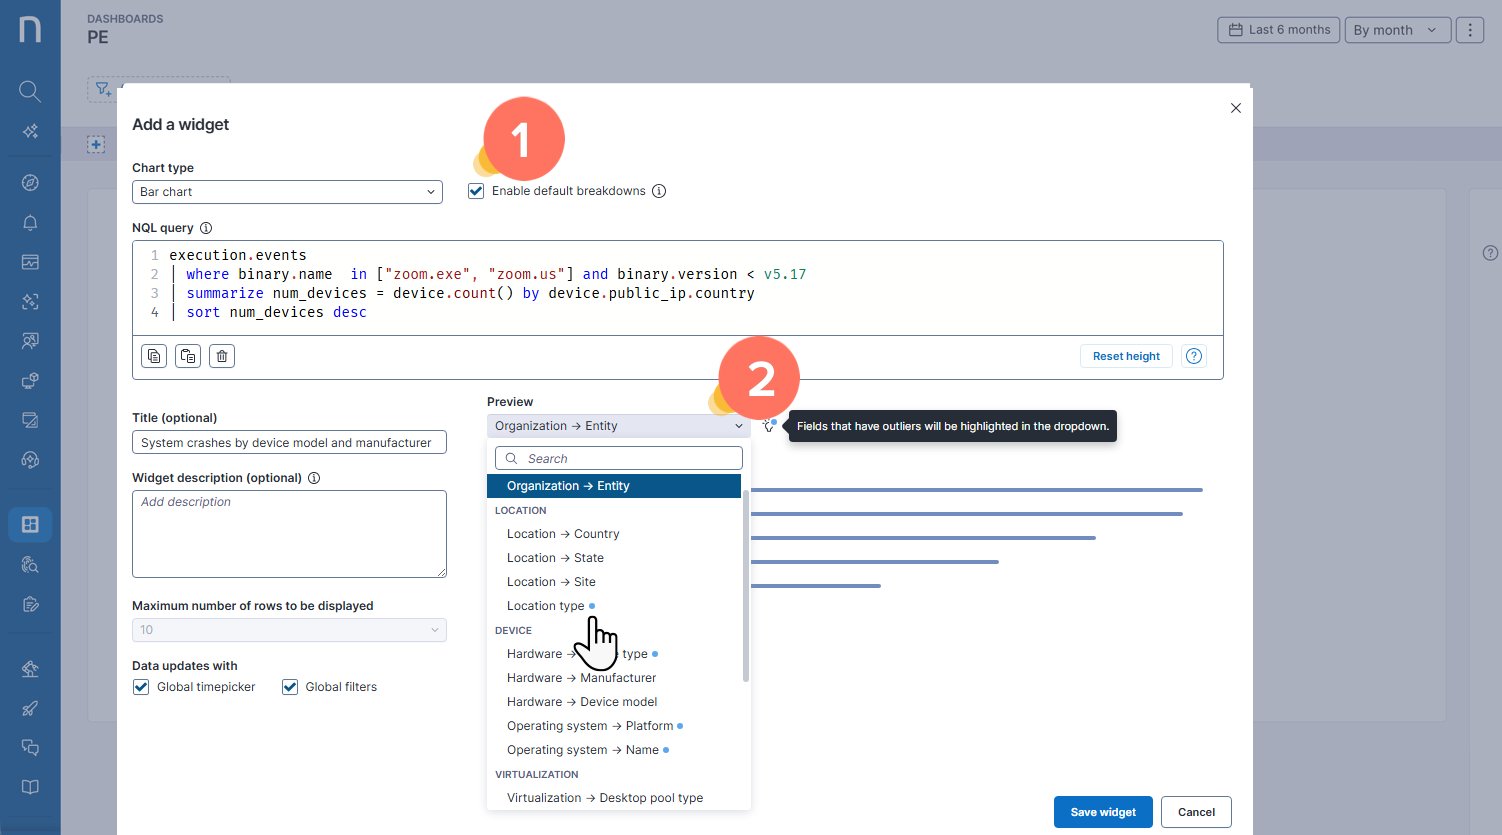
棒グラフ固有の[視覚化フィールドを設定](#linechart-linechartspecificsettings)する際に、**デフォルトの内訳**を有効にすると、棒グラフの上部に、あらかじめ設定された内訳のリストを含むドロップダウンが追加されます。
システムは、外れ値を含むドロップダウン内の内訳を強調表示します。これにより、関連する問題のパターンを特定できる場合があります。例えば、以下の画像では **Location type** が強調表示されています。
**デフォルトの内訳を有効化する**場合は、以下の NQL 構造に従う必要があります。
...
summarize , , ...
この場合、システムは内訳ドロップダウンのオプションをデフォルトとして使用するため、クエリから `by ,...` を省略できます。つまり、クエリ内の `by` 句は無視されます。下の画像の **プレビュー** セクションを参照してください。
{% hint style="info" %}
[ライブダッシュボードNQL例](/platform/ja/user-guide/live-dashboards/live-dashboards-nql-examples.md#livedashboardsnqlexamples-barchart) のドキュメントでクエリの例を確認してください。
{% endhint %}
## デフォルトの内訳を無効にした棒グラフの NQL 構造
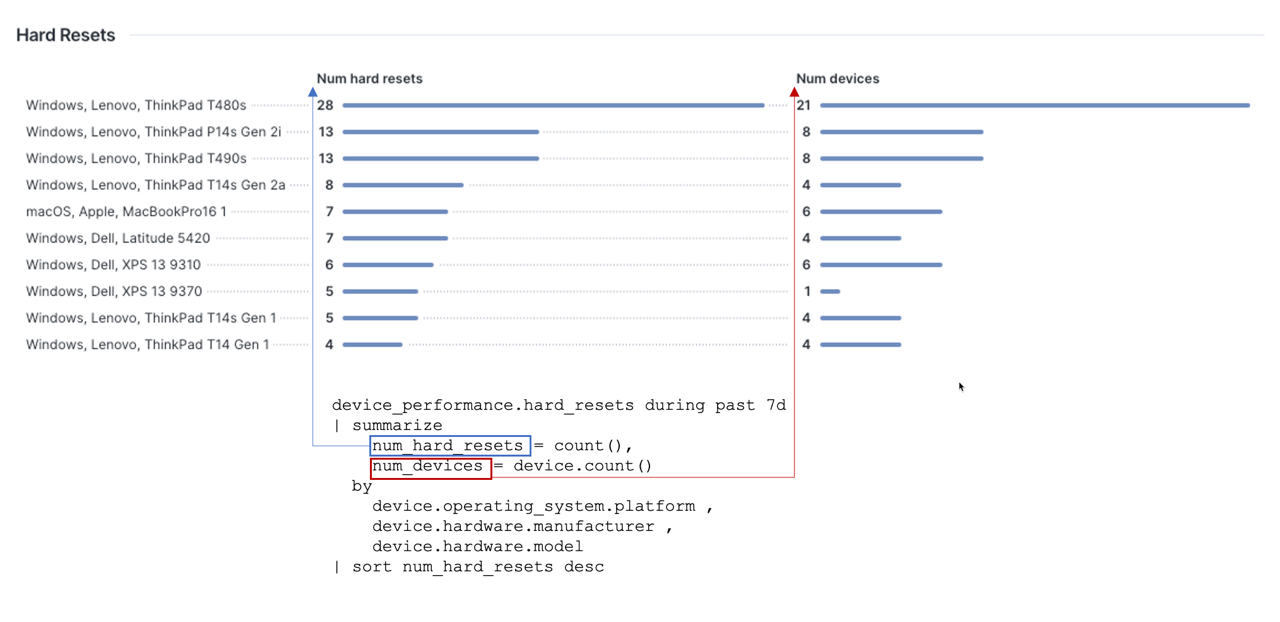
棒グラフに固有の[ビジュアライゼーションフィールドを設定](#linechart-linechartspecificsettings)する際、**デフォルトの内訳を有効にする**を選択しない場合は、以下の NQL 構造に従う必要があります。
```
...
summarize , , ... by , , ...
```
この場合、クエリでは常に `by ,...` を指定する必要があります。
{% hint style="info" %}
クエリの例については、[ライブダッシュボードの NQL の例](/platform/ja/user-guide/live-dashboards/live-dashboards-nql-examples.md#livedashboardsnqlexamples-barchart)のドキュメントを参照してください。
{% endhint %}
***
## 棒グラフの列名
NQL クエリ内の変数名は、列のラベルとして使用されます。
変数名は、次のヒューリスティックに従って書式設定されます:
* アンダースコアはスペースに置き換えられます。
* 変数名の先頭文字は大文字に変更されます。
{% hint style="info" %}
ライブダッシュボードの棒グラフウィジェットでは、グラフの列ヘッダーをクリックして結果を並べ替えることができます。
{% endhint %}
***
## 棒グラフに固有のビジュアライゼーションフィールドの設定
{% hint style="info" %}
このウィジェットに固有ではない残りの設定フィールドの入力方法については、[ライブダッシュボードの管理](/platform/ja/user-guide/live-dashboards/managing-live-dashboards.md#filling-in-widget-visualization-fields)のドキュメントを参照してください。
{% endhint %}
**グラフの種類**ドロップダウンから**棒グラフ**オプションを選択し、**デフォルトの内訳**を有効にするかどうかを決定して、グラフの**NQL クエリ**を定義した後:
1. ウィジェットに\*\*タイトル(任意)\*\*を付けます。
2. たとえば、指標の解釈方法や計算方法、指標に関する注意事項を説明するために、\*\*ウィジェットの説明(任意)\*\*を入力します。
* ウィジェットの説明は、ダッシュボードで棒グラフウィジェットの横にある情報アイコンにカーソルを合わせると表示されます。
3. 棒グラフの結果を、選択した**グローバルタイムピッカー**(期間)および/またはダッシュボードに適用された**グローバルフィルター**に応じて更新するかどうかを決定しますd**.**
* ライブダッシュボードの棒グラフウィジェットでは、アクションメニューから、グローバルダッシュボードフィルターに基づいて、結果を**すべて表示**するか、データを**フィルター済みで表示**するかを選択できます。
4. コンテナーに表示する**最大行数**を定義します。
* グラフの結果が定義した上限を超える場合、ダッシュボードには**さらに読み込む**ボタンが表示されます。
***
関連トピック
* [KPI](/platform/ja/user-guide/live-dashboards/widget-types/kpi.md)
* [折れ線グラフ](/platform/ja/user-guide/live-dashboards/widget-types/line-chart.md)
* [単一指標ゲージグラフ](/platform/ja/user-guide/live-dashboards/widget-types/single-metric-gauge-chart.md)
* [複数指標ゲージグラフ](/platform/ja/user-guide/live-dashboards/widget-types/multi-metric-gauge-chart.md)
* [テーブル](/platform/ja/user-guide/live-dashboards/widget-types/table.md)
* [見出し](/platform/ja/user-guide/live-dashboards/widget-types/heading.md)
* [フィルターウィジェット](/platform/ja/user-guide/live-dashboards/widget-types/filter-widget.md)
* [期間ピッカー](/platform/ja/user-guide/live-dashboards/widget-types/timeframe-picker.md)
---
# Agent Instructions
This documentation is published with GitBook. GitBook is the documentation platform designed so that both humans and AI agents can read, navigate, and reason over technical content effectively. Learn more at gitbook.com.
## Querying This Documentation
If you need additional information that is not directly available in this page, you can query the documentation by asking a question.
Perform an HTTP GET request on the following URL with the `ask` and `goal` query parameters:
```
GET https://docs.nexthink.com/platform/ja/user-guide/live-dashboards/widget-types/bar-chart.md?ask=&goal=
```
`ask` is the immediate question: it should be specific, self-contained, and written in natural language.
`goal` is what the user is ultimately trying to achieve, the reason they need the answer. Sharing it helps GitBook give you a better, more relevant answer. A goal is most helpful when it describes the outcome the user wants rather than restating the question. For example, with `ask=how do I create an API token`, a goal like `automate deployments from our CI pipeline` lets GitBook tailor the answer to that use case.
The response will contain a direct answer to the question and relevant excerpts and sources from the documentation.
Use this mechanism when the answer is not explicitly present in the current page, you need clarification or additional context, or you want to retrieve related documentation sections.
.png?alt=media)