> For the complete documentation index, see [llms.txt](https://docs.nexthink.com/llms.txt). Markdown versions of documentation pages are available by appending `.md` to page URLs; this page is available as [Markdown](https://docs.nexthink.com/platform/ja/library-packs/applications/web-application-advanced-troubleshooting/usage-guide_-web-application-advanced-troubleshooting.md).
# 利用ガイド:Web アプリケーションの高度なトラブルシューティング
## はじめに
このライブラリパックは、Webアプリケーションのパフォーマンスをモニタリング、管理、そして向上させる手助けをします。このページでは、コンテンツの構成とその使い方についてのガイドを提供します。
これはガイドであり、あくまで得られるインサイトや実行可能なアクションの一部を示しています。あなたの環境内で発見される多くのユースケースや特定のトラブルシューティングシナリオがあります。
{% hint style="info" %}
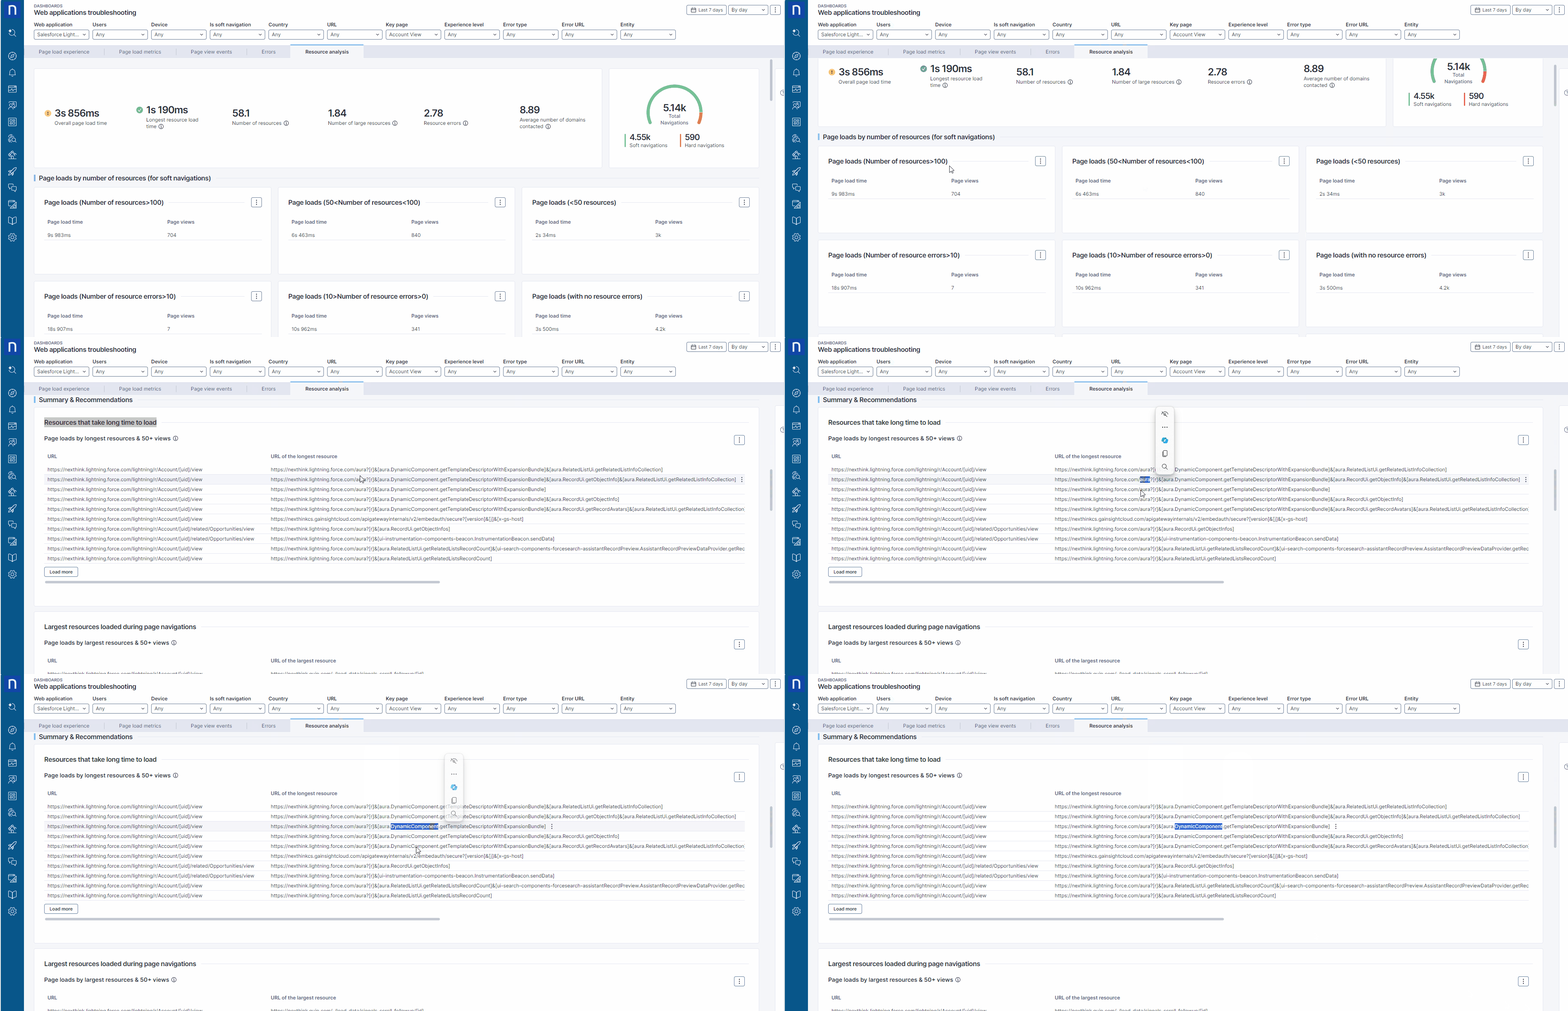
遅いページロードを診断するためのウォーターフォールメトリクスの詳細はこの[ドキュメントページ](https://nexthink.gitbook.io/opd/user-guide/applications/monitoring-applications/monitoring-web-applications/troubleshoot)をご覧ください。
{% endhint %}
## パックの構成
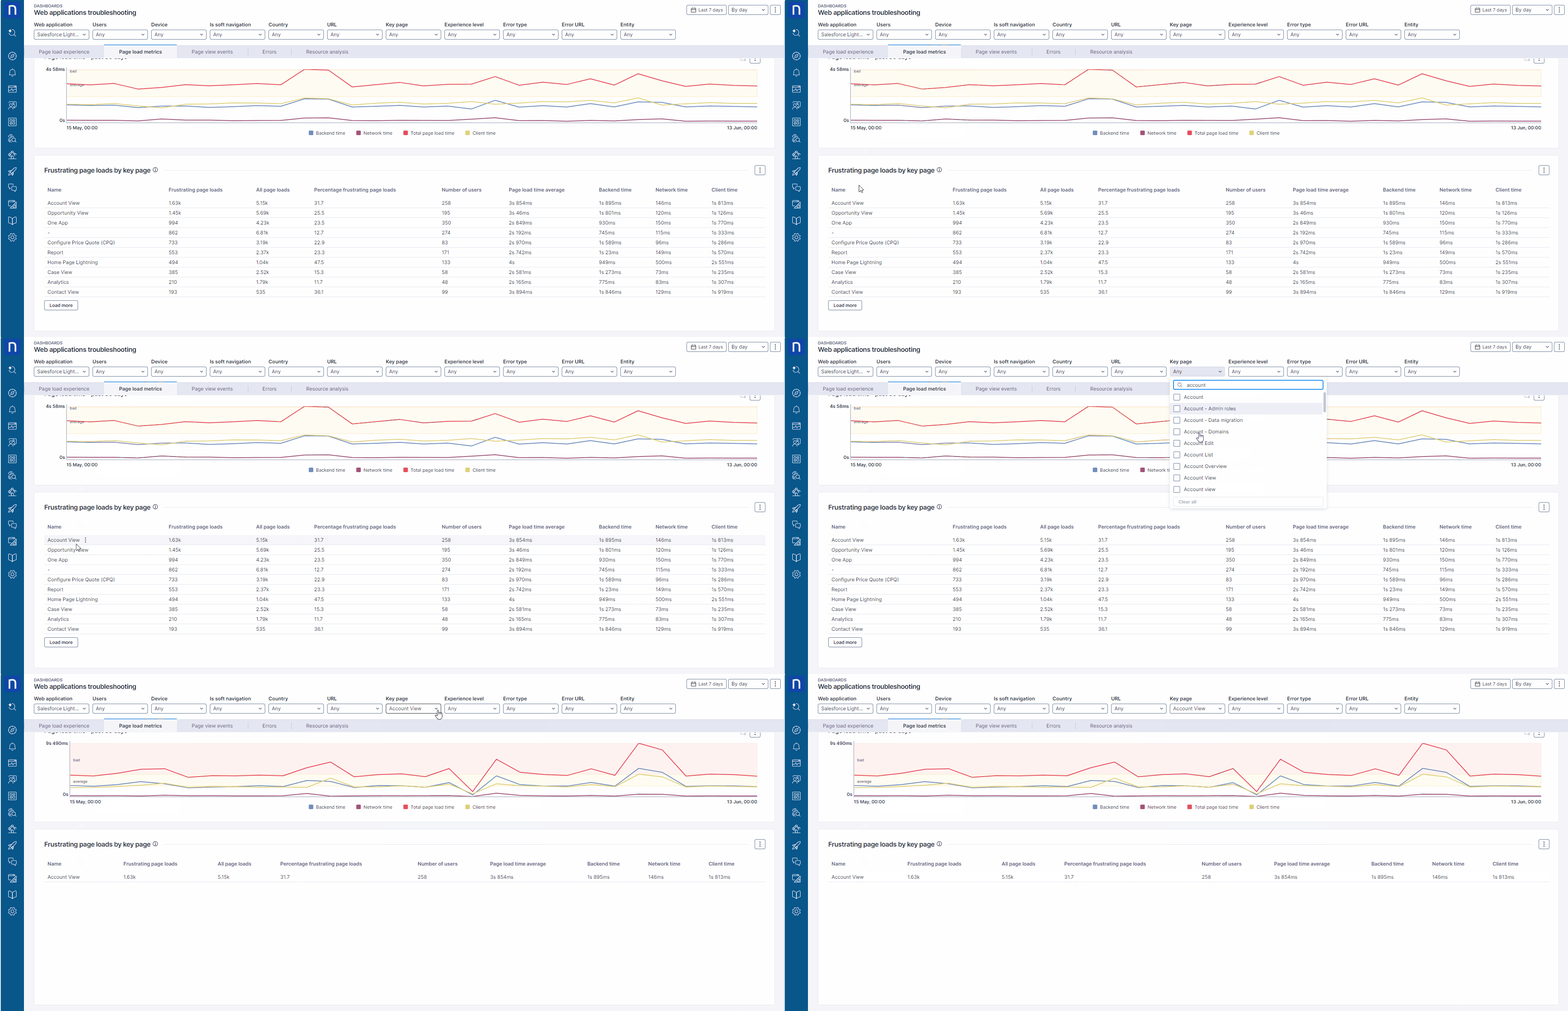
**「Webアプリケーショントラブルシューティング」** [ライブダッシュボード](https://nexthink.gitbook.io/opd/user-guide/live-dashboards)は、あなたのWebアプリケーションの使用環境を見える化し、容易にモニタリングすることができます。
特定のアプリケーションWebクライアントの全体的な健康と信頼性についての追加の可視性は[Applications](https://nexthink.gitbook.io/opd/user-guide/applications)モジュールから確認できます。
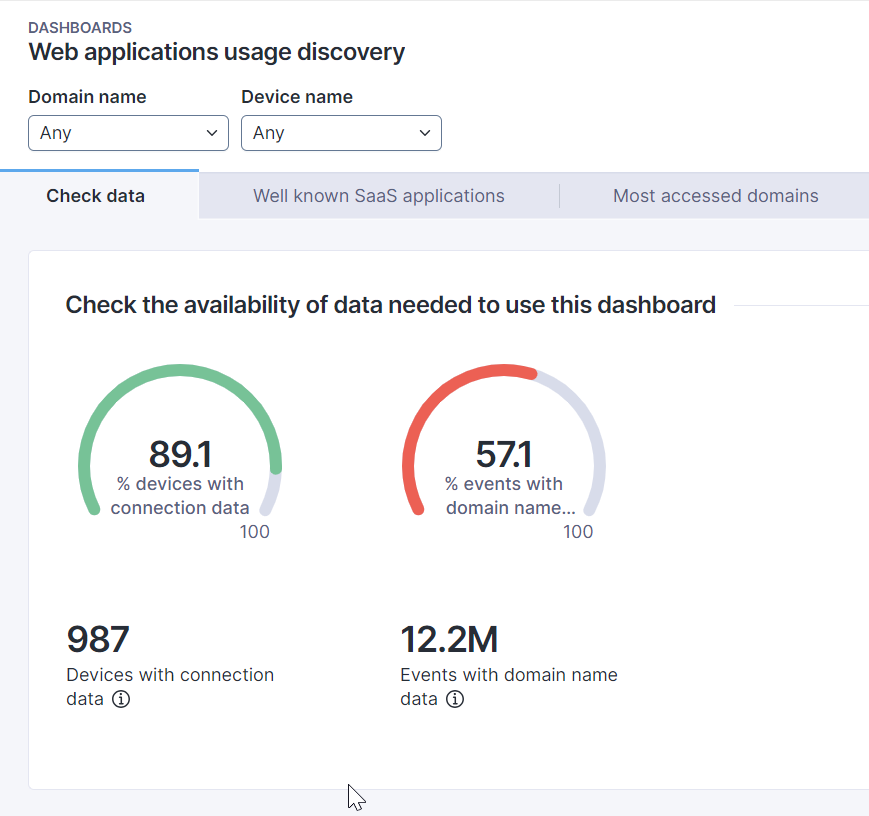
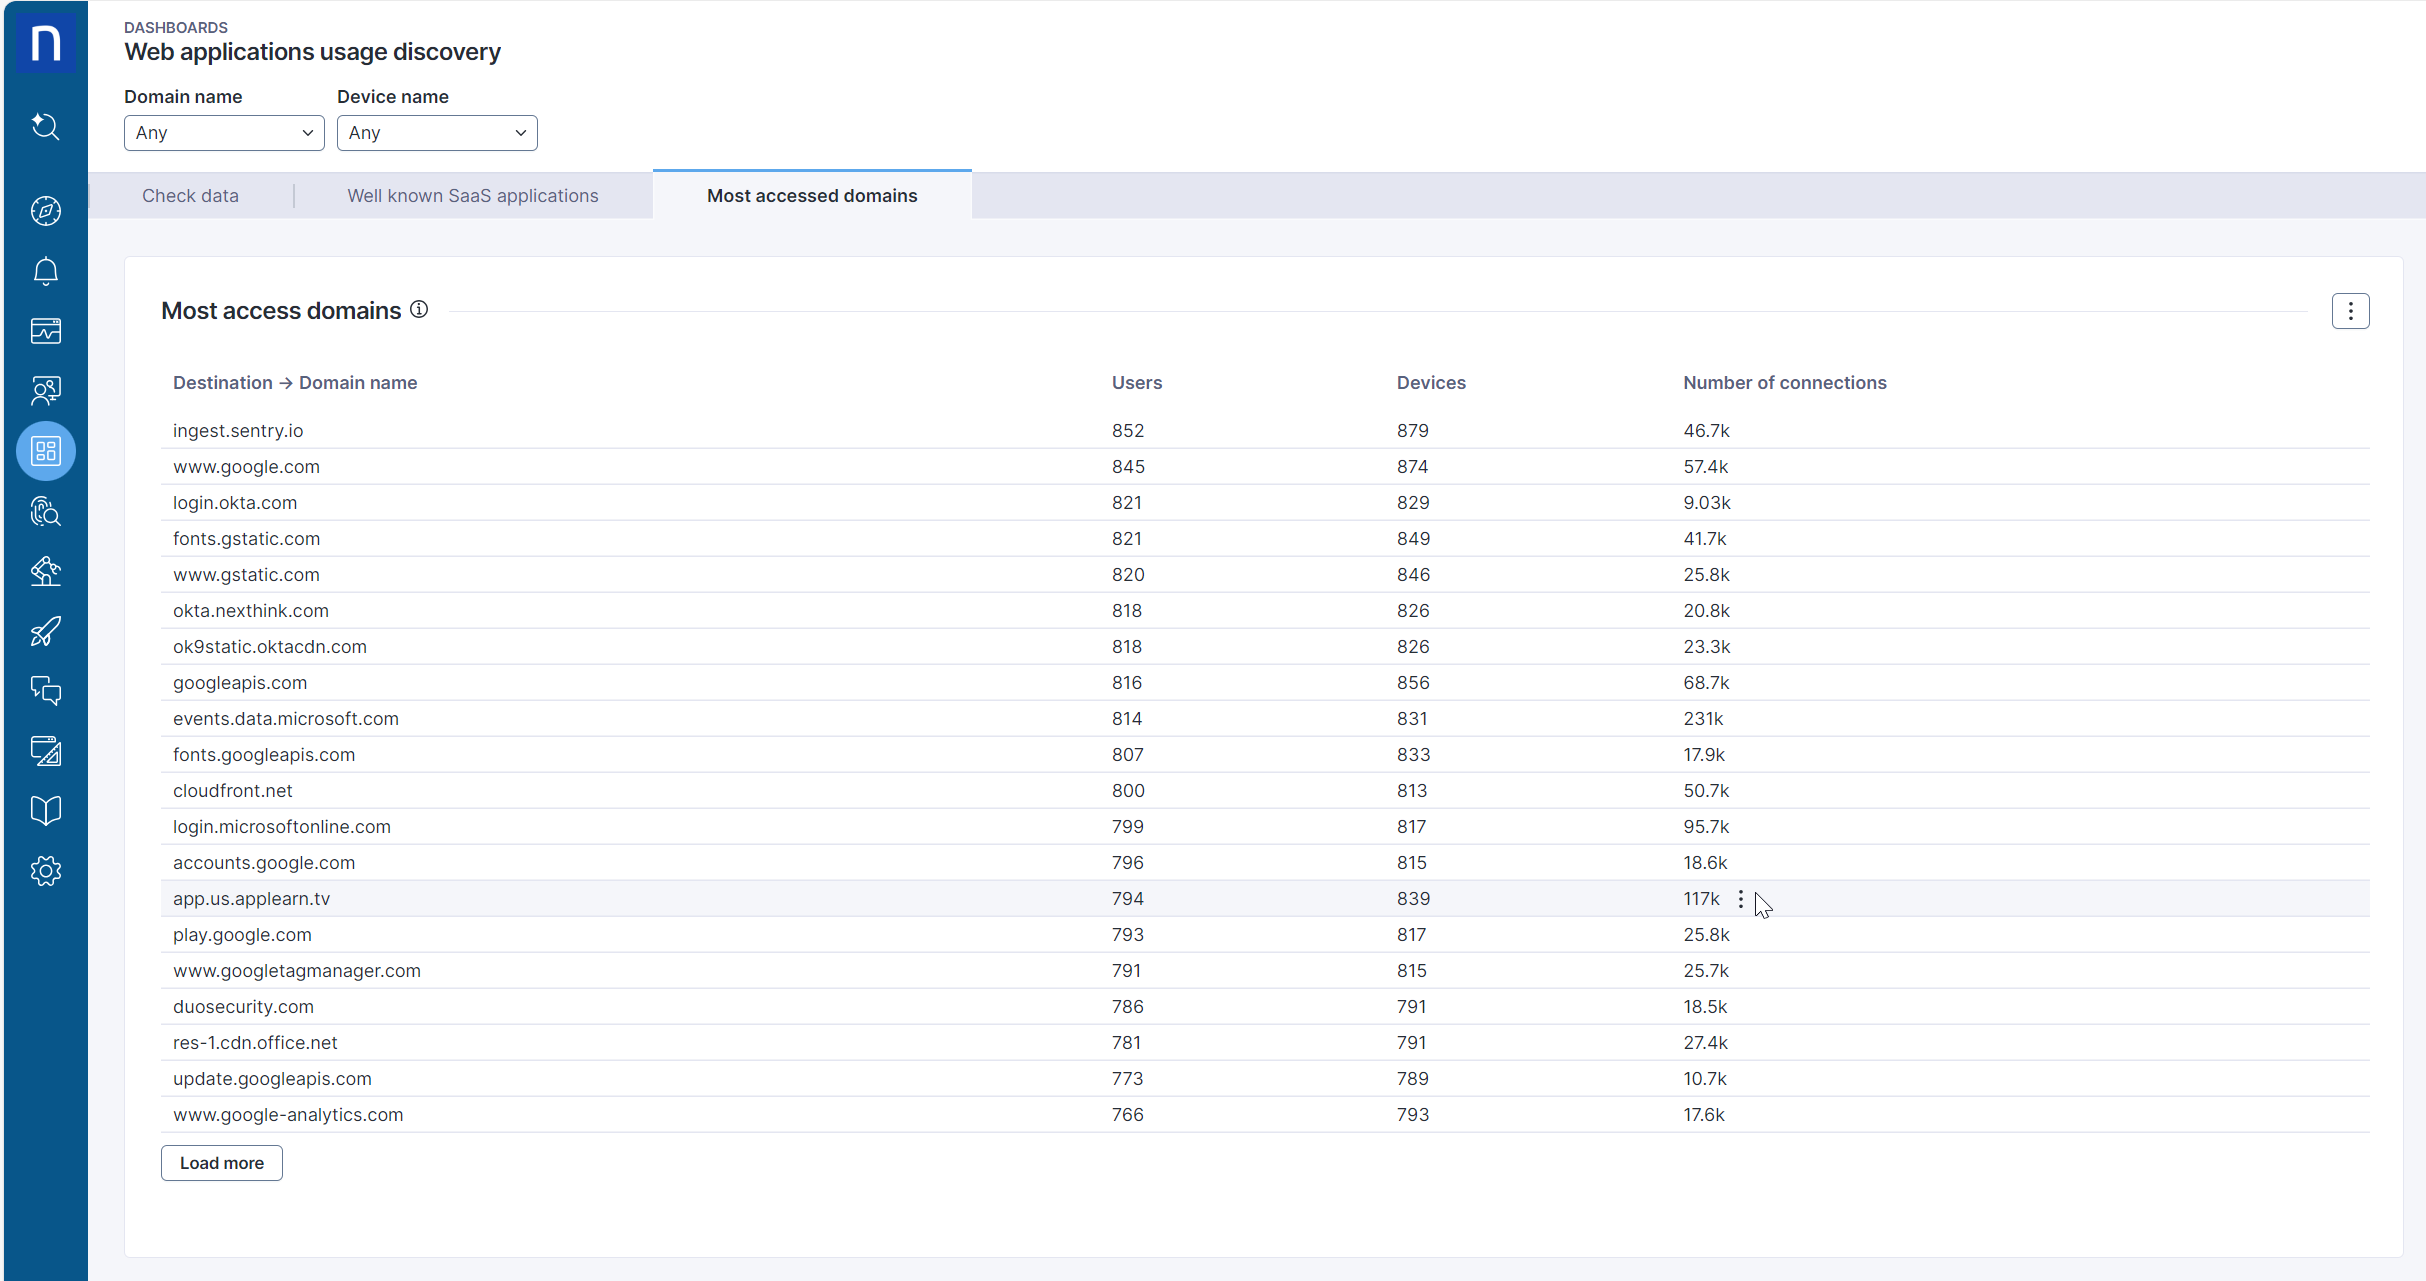
**「Webアプリケーション使用状況調査」** [ライブダッシュボード](https://nexthink.gitbook.io/opd/user-guide/live-dashboards)は、あなたのネットワーク接続について報告します。アクセスされた全てのドメインの全体像を示し、頻度、ユーザー、各ドメインに関連するデバイスを詳細に示します。
## ユースケース
### **Webアプリケーションの改善箇所を特定する**
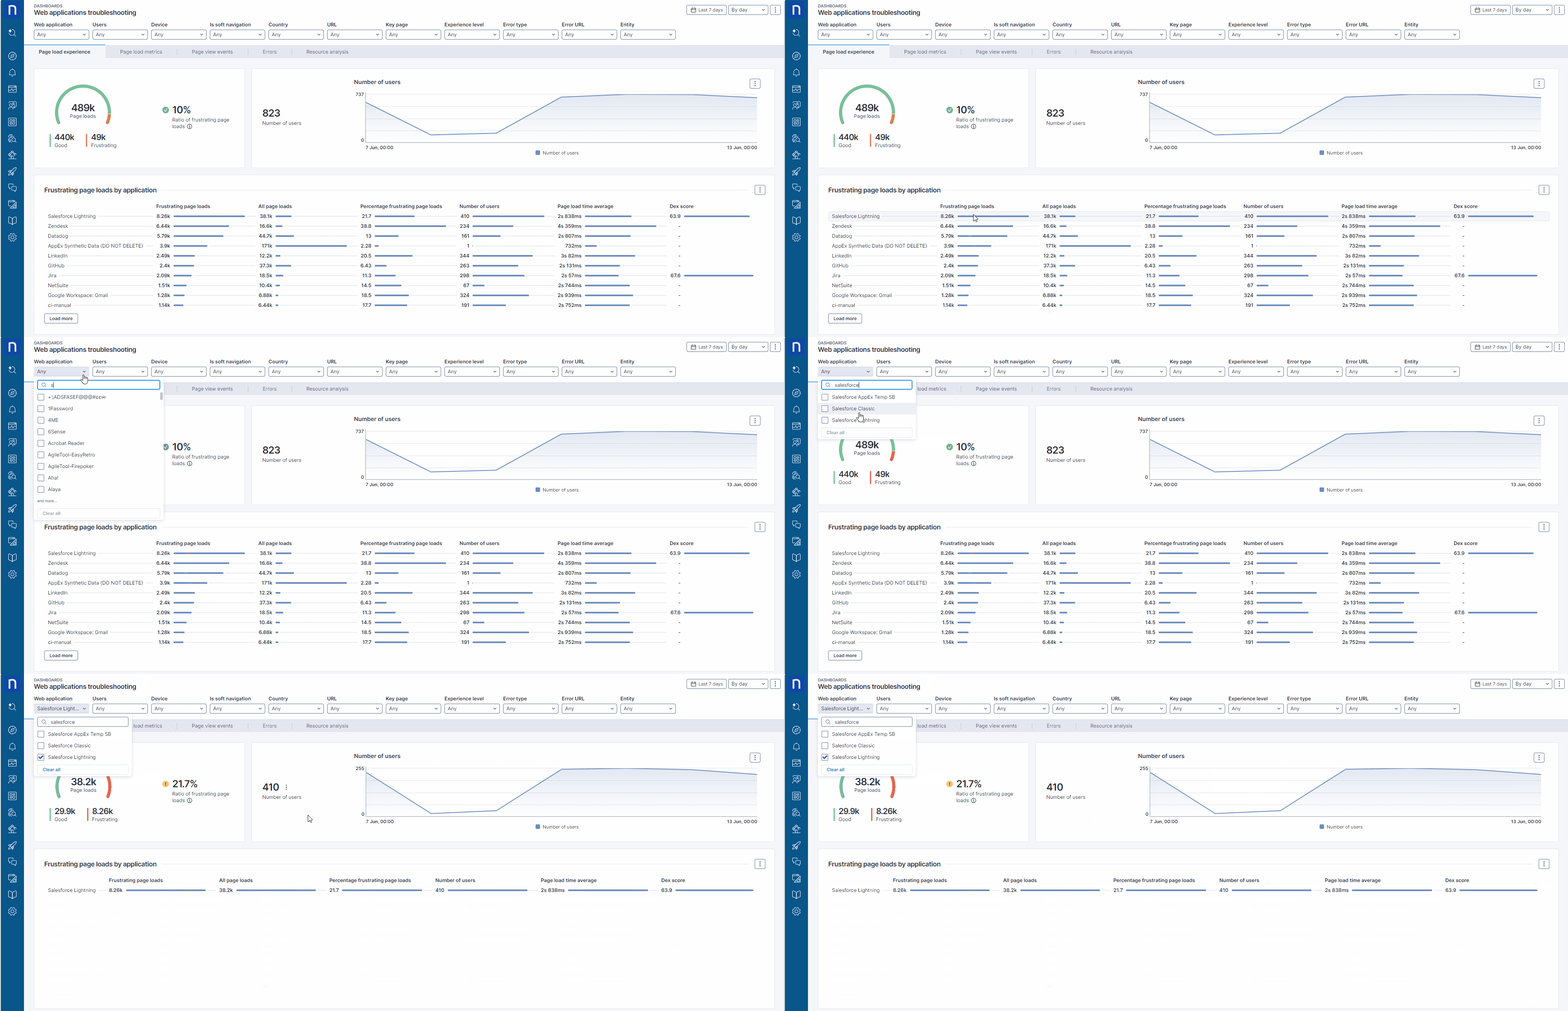
**「ページロード体験」タブでは、「Webアプリケーショントラブルシューティング」** [ライブダッシュボード](https://nexthink.gitbook.io/opd/user-guide/live-dashboards)で潜在的な問題領域の包括的な概要を提供します。このデータを利用して、集中すべき特定のアプリケーションを特定することができます。例えば、\*\*「苛立たしいページロード」\*\*メトリックは、アプリケーション選定の基準として利用できます。
ダッシュボード上部のフィルターを使用することで、特定のアプリケーションの可視性に集中することができます。時間セレクターを使用することで、より詳細、または長期間にわたるデータを確認することができます。
**「よく知られたSaaSアプリケーション」** タブは、最も多く使用される認識されたSaaSアプリケーションと、それに関連する一般的に使用されるドメインを提示します。この機能は、特に「URLパターン」構成属性の正しい設定に関連して、Webアプリケーションの設定の正確性を確認するのに役立ちます。
**「最もアクセスされたドメイン」** タブは、Edge、Chrome、Firefoxのようなウェブブラウザを通じてアクセスされたドメイン名を一覧表示します。このテーブルを使用して、あなたの環境内で使用されているWebアプリケーションのURLを特定します。最も頻繁に使用されるWebアプリケーションのURLを特定した後、これらをモニタリング用に設定することができます。
***
関連トピック
* [Applications](https://nexthink.gitbook.io/opd/user-guide/applications)
* [Webアプリケーションのモニタリング](https://nexthink.gitbook.io/opd/user-guide/applications/monitoring-applications/monitoring-web-applications)
---
# Agent Instructions
This documentation is published with GitBook. GitBook is the documentation platform designed so that both humans and AI agents can read, navigate, and reason over technical content effectively. Learn more at gitbook.com.
## Querying This Documentation
If you need additional information that is not directly available in this page, you can query the documentation by asking a question.
Perform an HTTP GET request on the following URL with the `ask` and `goal` query parameters:
```
GET https://docs.nexthink.com/platform/ja/library-packs/applications/web-application-advanced-troubleshooting/usage-guide_-web-application-advanced-troubleshooting.md?ask=&goal=
```
`ask` is the immediate question: it should be specific, self-contained, and written in natural language.
`goal` is what the user is ultimately trying to achieve, the reason they need the answer. Sharing it helps GitBook give you a better, more relevant answer. A goal is most helpful when it describes the outcome the user wants rather than restating the question. For example, with `ask=how do I create an API token`, a goal like `automate deployments from our CI pipeline` lets GitBook tailor the answer to that use case.
The response will contain a direct answer to the question and relevant excerpts and sources from the documentation.
Use this mechanism when the answer is not explicitly present in the current page, you need clarification or additional context, or you want to retrieve related documentation sections.