Timeframe picker

This page details how Nexthink implements the timeframe picker and time granularity into NQL queries to filter and adjust dashboard visualizations.

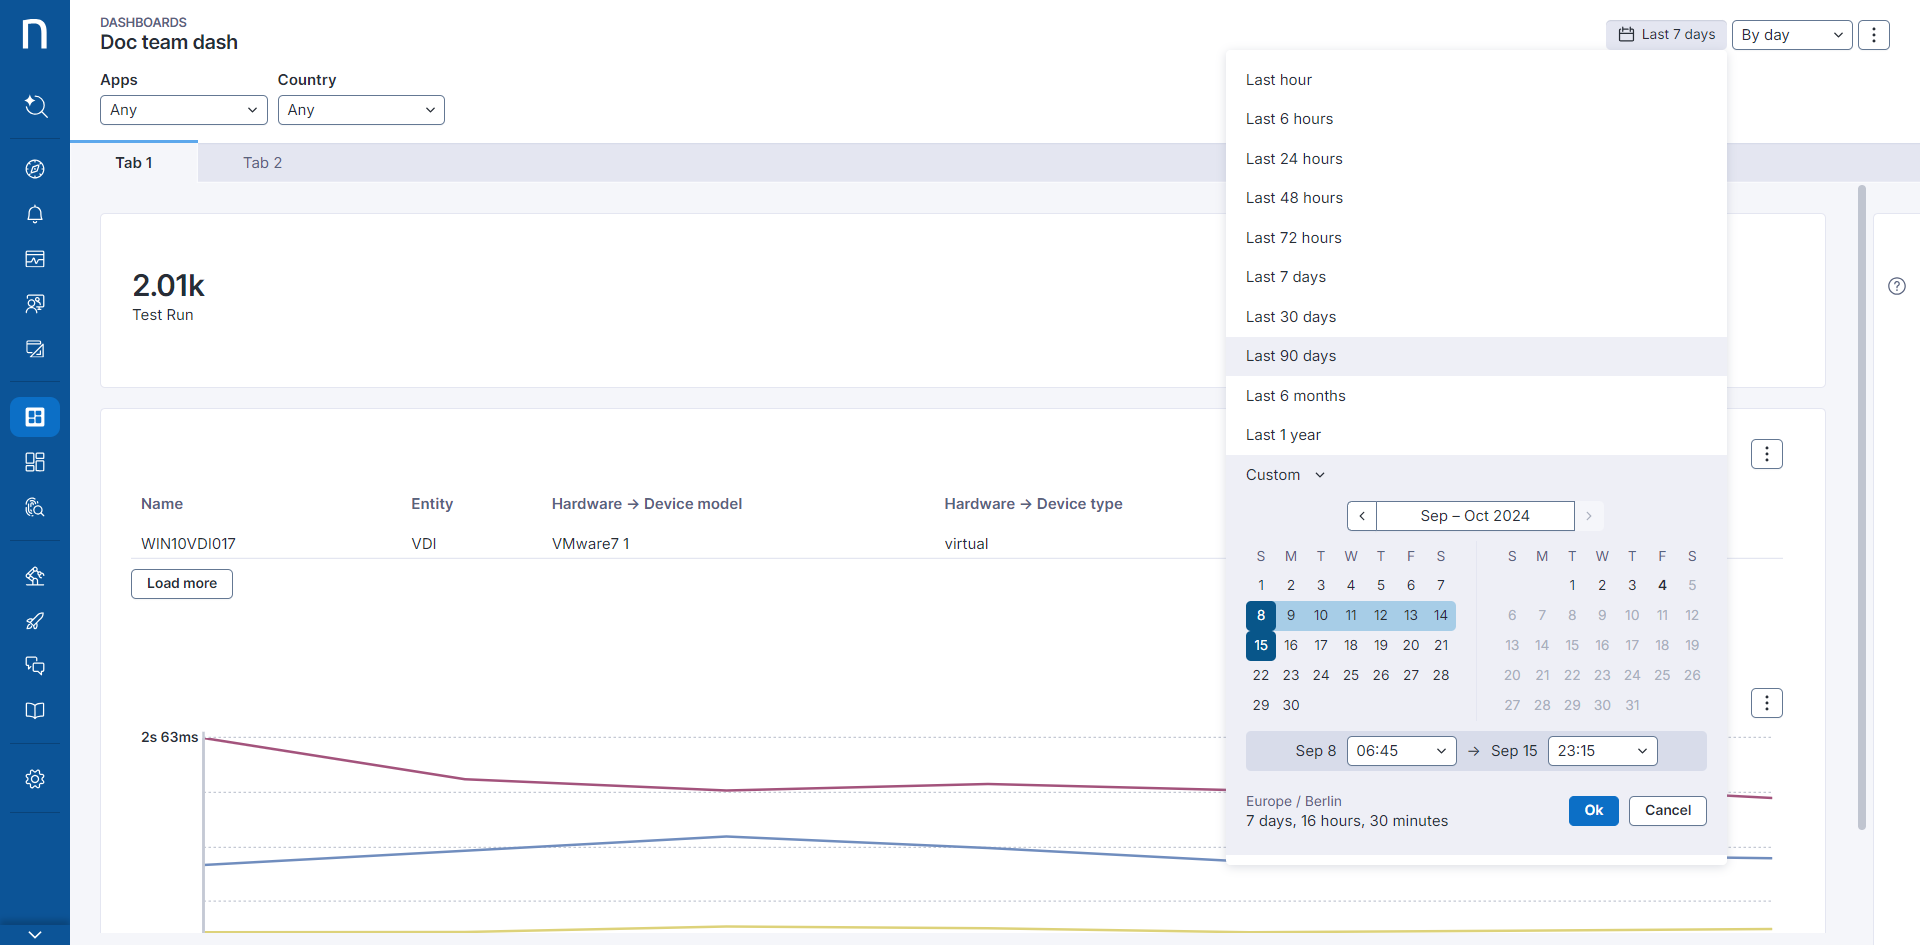
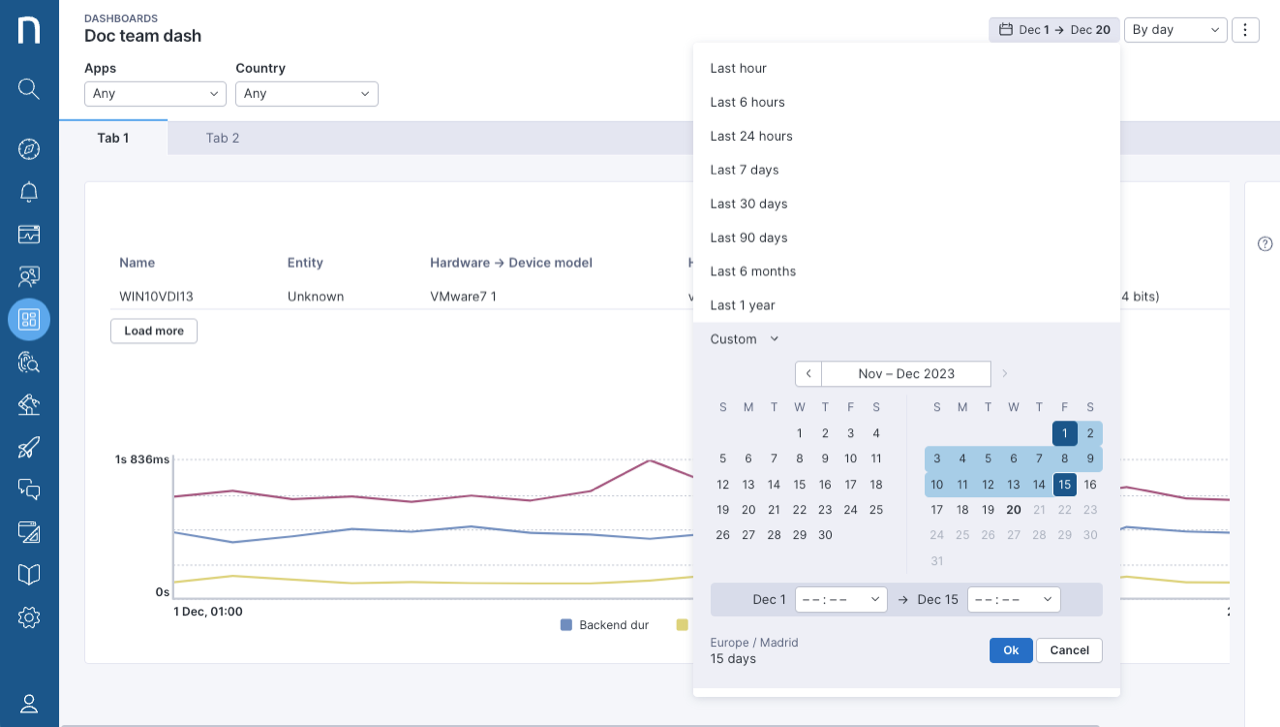
All dashboards have the option of predefined and custom timeframes which apply to all dashboard tabs. In addition, choose and modify the time granularity for line charts.

Refer to the Using Live Dashboards documentation to learn how to pick timeframes.

Predefined timeframes

Available predefined timeframes:

  • Last hour

  • Last 6 hours

  • Last 24 hours

  • Last 48 hours

  • Last 72 hours

  • Last 7 days

  • Last 30 days

  • Last 90 days

  • Last 6 months

  • Last 1 year

Depending on the predefined timeframe you choose, set different levels of time granularity to identify patterns and troubleshoot issues—see the Supported granularities on this page. The Custom date and Time range section delves into custom timeframes and their default granularities implemented in NQL queries.

Last hour

The dashboard applies the following NQL time specification to the queries:

during past 60min
...
(by 15 min)

The NQL query takes into account four 15-minute time buckets. The amount of data that the last 15-minute bucket contains depends on what time the user loads the dashboard. This means that for the last hour, the user will see anywhere from 45 minutes of data to 59 minutes of data.

Viewer time = 18:39

Start time
End time
Amount of data

1

17:45

18:00

Full 15 minutes of data

2

18:00

18:15

Full 15 minutes of data

3

18:15

18:30

Full 15 minutes of data

4

18:30

18:45

9 minutes of data (from 18:30 - 18:39 current time)

During past 1h does not equal During past 60 min

NQL currently interprets during past 1h differently from during past 60min. To ensure consistency between the results in Investigations and in Live Dashboards, use during past 60min in widget queries.

  • Examples of during past 1h.

execution.events during past 1h
| summarize num_freezes = number_of_freezes.sum() by 15min

The data starts from the beginning of the last full hour.

Viewer time = 18:39

Start time
End time
Amount of data

1

18:00

18:15

Full 15 minutes of data

2

18:15

18:30

Full 15 minutes of data

3

18:30

18:45

9 minutes of data (from 18:30 - 18:39 current time)

Last 6 hours

The dashboard applies the following NQL time specification to the queries:

during past 360min
...
(by 15min | 1h)

The NQL query takes into account twenty-four, 15-minute time buckets. The amount of data that the last 15-minute bucket contains depends on what time the user loads the dashboard. This means that for the last 6 hours, the user can see anywhere from 5 hours 45 minutes of data to 5 hours 59 minutes of data.

  • Example of during past 360min

Viewer time = 18:39

Start time
End time
Amount of data

1

12:45

13:00

Full 15 minutes of data

2

13:00

13:15

Full 15 minutes of data

3

13:15

13:30

Full 15 minutes of data

...

21

17:45

18:00

Full 15 minutes of data

22

18:00

18:15

Full 15 minutes of data

23

18:15

18:30

Full 15 minutes of data

24

18:30

18:45

9 minutes of data (from 18:30 - 18:39 current time)

Last 24 hours

The dashboard applies the following NQL time specification to the queries:

during past 24h
...
(by 1h | 15min)

The NQL query takes into account twenty-four 1-hour time buckets. The amount of data that the last 1-hour bucket contains depends on what time the user loads the dashboard. This means that for the last 24 hours, the user can see anywhere from 23 hours of data to 23 hours 59 minutes of data.

  • Example of during past 24h

Viewer time = 18:39

Start time
End time
Amount of data

1

19:00

20:00

Full hour of data

2

20:00

21:00

Full hour of data

...

23

17:00

18:00

Full hour of data

24

18:00

19:00

39 minutes of data (from 18:00 - 18:39 current time)

Last 48 hours

The dashboard applies the following NQL time specification to the queries:

during past 48h 
... 
(by 1h | 15min)

The NQL query takes into account forty-eight 1-hour time buckets. The amount of data that the last 1-hour bucket contains depends on what time the user loads the dashboard. This means that for the last 48 hours, the user can see anywhere from 47 hours of data to 47 hours 59 minutes of data.

  • Example of during past 48h

Viewer time = April 13, 18:39

Start time
End time
Amount of data

1

April 13, 19:00

April 13, 20:00

Full hour of data

2

April 13, 20:00

April 13, 21:00

Full hour of data

...

47

April 14, 17:00

April 14, 18:00

Full hour of data

48

April 14, 18:00

April 14,19:00

39 minutes of data (from 18:00 - 18:39 current time)

Last 72 hours

The dashboard applies the following NQL time specification to the queries:

during past 72h 
... 
(by 1h | 15min)

The NQL query takes into account seventy-two 1-hour time buckets. The amount of data that the last 1-hour bucket contains depends on what time the user loads the dashboard. This means that for the last 72 hours, the user can see anywhere from 71 hours of data to 72 hours 59 minutes of data.

  • Example of during past 72h

Viewer time = April 13, 18:39

Start time
End time
Amount of data

1

April 13, 19:00

April 13, 20:00

Full hour of data

2

April 13, 20:00

April 13, 21:00

Full hour of data

...

71

April 15, 17:00

April 15, 18:00

Full hour of data

72

April 15, 18:00

April 15, 19:00

39 minutes of data (from 18:00 - 18:39 current time)

Last 7 days

The dashboard applies the following NQL time specification to the queries:

during past 7d
...
(by 1d)

The NQL query takes into account seven 1-day time buckets. The amount of data that the last 1-day bucket contains depends on the time that the user loads the dashboard. This means that for the last 7 days, the user can see anywhere from 6 days of data to 6 days 23 hours 59 minutes of data.

The start of the day is defined by the timezone that the server is located in.

  • Example where the viewer timezone matches the server timezone:

Viewer time = April 13, 18:39 Eastern Time (GMT-4) Server time = April 13, 18:39 Eastern Time (GMT-4)

Start time
End time
Amount of data

1

2022-04-07, 00:00

2022-04-08, 00:00

Full day of data

2

2022-04-08, 00:00

2022-04-09, 00:00

Full day of data

3

2022-04-09, 00:00

2022-04-10, 00:00

Full day of data

4

2022-04-10, 00:00

2022-04-11, 00:00

Full day of data

5

2022-04-11, 00:00

2022-04-12, 00:00

Full day of data

6

2022-04-12, 00:00

2022-04-13, 00:00

Full day of data

7

2022-04-13, 00:00

2022-04-14, 00:00

18 hours 39 minutes of data

  • Example where the viewer timezone does not match the server timezone:

Viewer time = April 13, 18:39 Eastern Time (GMT-4) Server time = April 13, 15:39 Pacific Time (GMT-7)

Start time

End time

Amount of data

1

2022-04-07, 03:00

2022-04-08, 03:00

Full day of data

2

2022-04-08, 03:00

2022-04-09, 03:00

Full day of data

3

2022-04-09, 03:00

2022-04-10, 03:00

Full day of data

4

2022-04-10, 03:00

2022-04-11, 03:00

Full day of data

5

2022-04-11, 03:00

2022-04-12, 03:00

Full day of data

6

2022-04-12, 03:00

2022-04-13, 03:00

Full day of data

7

2022-04-13, 03:00

2022-04-14, 03:00

15 hours 39 minutes of data

Last 30 days

The dashboard applies the following NQL time specification to the queries:

during past 30d
...
(by 1d | 7d)

The NQL query takes into account thirty 1-day time buckets. The amount of data that the last 1-day bucket contains depends on the time that the user loads the dashboard. This means that for the last 30 days, the user can see anywhere from 29 days of data to 29 days 23 hours 59 minutes of data.

The start of the day is defined by the timezone that the server is located in.

  • Example where the viewer timezone matches the server timezone:

Viewer time = April 13, 18:39 Eastern Time (GMT-4) Server time = April 13, 18:39 Eastern Time (GMT-4)

Start time
End time
Amount of data

1

2022-03-15, 00:00

2022-03-16, 00:00

Full day of data

2

2022-03-16, 00:00

2022-03-17, 00:00

Full day of data

3

2022-03-17, 00:00

2022-03-18, 00:00

Full day of data

29

2022-04-12, 00:00

2022-04-13, 00:00

Full day of data

30

2022-04-13, 00:00

2022-04-14, 00:00

18 hours 39 minutes of data

  • Example where the viewer timezone does not match the server timezone:

Viewer time = April 13, 18:39 Eastern Time (GMT-4) Server time = April 13, 15:39 Pacific Time (GMT-7)

Start time
End time
Amount of data

1

2022-03-15, 03:00

2022-03-16, 03:00

Full day of data

2

2022-03-16, 03:00

2022-03-17, 03:00

Full day of data

3

2022-03-17, 03:00

2022-03-18, 03:00

Full day of data

29

2022-04-12, 03:00

2022-04-13, 03:00

Full day of data

30

2022-04-13, 03:00

2022-04-14, 03:00

15 hours 39 minutes of data

Last 90 days

The dashboard applies the following NQL time specification to the queries:

during past 90d
...
(by 30d | by 7d | by 1d)

The NQL query takes into account ninety 1-day time buckets. The amount of data that the last 7-day bucket contains depends on the time that the user loads the dashboard. This means that for the last 90 days, the user can see anywhere from 89 days of data to 89 days 23 hours 59 minutes of data.

The start of the day is defined by the timezone that the server is located in.

Last 6 months

The dashboard applies the following NQL time specification to the queries:

during past 180d
...
(by 30d | 7d | 1d)

The NQL query takes into account one hundred and eighty 1-day time buckets. The amount of data that the last 30-day bucket contains depends on the time that the user loads the dashboard. This means that for the last 180 days, the user can see anywhere from 179 days of data to 179 days 23 hours 59 minutes of data.

The start of the day is defined by the timezone that the server is located in.

Last 1 year

The dashboard applies the following NQL time specification to the queries:

during past 365d
...
(by 30d | 7d | 1d)

The NQL query takes into account three hundred and sixty-five 1-day time buckets. The amount of data that the last 30-day bucket contains depends on the time that the user loads the dashboard. This means that for the last 365 days, the user can see anywhere from 364 days of data to 364 days 23 hours 59 minutes of data.

The start of the day is defined by the timezone that the server is located in.

Custom date and time range

The timeframe picker allows you to select a custom date range and a custom time range. Specify start and end times if the total timeframe is less than 72 hours. If the timeframe exceeds 72 hours, the selection will default to a date range, spanning from midnight of the starting date to midnight of the day following the selected end date.

The options for the granularity selector will depend on the length of the timeframe you have selected.

Custom date range

When you select only dates without specifying times, the dashboard applies the following NQL time specification to the queries:

NQL time specification:

from <start day> to <end day + 1 day> 
...
(by 1d | 7d | 30d)

This translates to different time spans depending on the underlying data and any differences between the user's timezone and the server's timezone.

Bucketized events

For bucketized event data the query returns the last 7 complete days and the current day. Each day is defined as midnight to midnight of the server's timezone. If the server's timezone differs from the user's timezone, midnight server time is converted to the user's timezone.

Start time
End time

2022-04-01, 02:00

2022-04-02, 02:00

2022-04-03, 02:00

2022-04-04, 02:00

Selected range = April 1st to April 3rd Viewer time = April 13, 18:39 Eastern Time (GMT-4) Server time = April 13, 16:39 Mountain Time (GMT-6)

Punctual events

For punctual event data, the query returns the last 7 complete days and the current day. Each day is defined as midnight to midnight of the user’s timezone.

Start time
End time

2022-04-01, 00:00

2022-04-02, 00:00

2022-04-03, 00:00

2022-04-04, 00:00

Selected range = April 1st to April 3rd Viewer time = April 13, 18:39 Eastern Time (GMT-4) Server time = April 13, 16:39 Mountain Time (GMT-6)

Custom time range

If you select a date range of 8 days or fewer, you can also specify the start and end times.

Time ranges translate to the the following NQL:

from <start day, start time> to <end day, end time> 
...
(by 1h | 15min)

Supported granularities

The available time granularity depends on the selected timeframe.

The time granularity drop-down only updates line charts.

Time frame
By 15 min
By hour
By day
By week
By month

Last 1 hour

Yes (default)

Last 6 hours

Yes (default)

Yes

Last 24 hours

Yes

Yes (default)

Last 48 hours

Yes

Yes (default)

Last 72 hours

Yes

Yes (default)

Last 7 days

Yes (default)

Last 30 days

Yes (default)

Yes

Last 90 days

Yes

Yes (default)

Last 6 months

Yes

Yes

Yes (default)

Last 1 year

Yes

Yes

Yes (default)

Custom time selection

< 2 hours

Yes (default)

2 - 6 hours

Yes (default)

Yes

6 hours - 8 days

Yes

Yes (default)

Custom day selection

1 - 8 days

Yes

Yes

Yes (default)

9 - 30 days

Yes (default)

Yes

31 - 90 days

Yes

Yes (default)

91+ days

Yes

Yes

Yes (default)

NQL translation

Timeframe option
NQL equivalent

By 15 min

by 15min

By hour

by 1h

By day

by 1d

By week

by 7d

By month

by 30d

By week note

The by week granularity does not align with the start of a calendar week. For example, if you are in the US where the week typically starts on Sunday, you might expect each data point to begin consistently on a Sunday. However, this is not the case. Instead, the system considers 7-day intervals starting from the beginning of the selected time period.

Example:

  • Current date and time: Friday, June 14, 10:00

  • Time duration: Last 30 days

  • Granularity: by week

Start time
End time
Amount of data

May 16, Thu 00:00

May 22, Wed 11:59

7 days

May 23, Thu 00:00

May 29, Wed 11:59

7 days

May 30, Thu 00:00

Jun 5, Wed 11:59

7 days

Jun 6, Thu 00:00

Jun 12, Wed 11:59

7 days

Jun 13, Thu 00:00

Jun 14, Fri 11:59

1 day, 10 hours

By month note

The by month granularity does not align with the start of the calendar month. You might expect each data point to begin consistently on the first day of the month: January 1, February 1, March 1, etc. However, this is not the case. Instead, the system considers 30-day intervals starting from the beginning of the selected time period.

Example

  • Current date and time: Friday, June 14, 10:00

  • Time duration: Last 6 months

  • Granularity: by month

Start time
End time
Amount of data

Dec 18, 00:00

Jan 16, 11:59

30 days

Jan 17, 00:00

Feb 15, 11:59

30 days

Feb 16, 00:00

Mar 16, 11:59

30 days

Mar 17, 00:00

Apr 15, 11:59

30 days

Apr 16, 00:00

May 15, 11:59

30 days

May 16, 00:00

Jun 14, 11:59

30 days

Applying time duration to widget NQL queries

The dashboard applies the timeframe picker duration and granularity to all NQL queries when possible.

The following scenarios exemplify query changes based on timeframes and granularity combinations.

Event table with no time specification

Original query in a widget:

execution.crashes
| summarize num_crashes = number_of_crashes.sum()

Modified query:

execution.crashes <timepicker period>
| summarize num_crashes = number_of_crashes.sum()

Event table with a time specification

Original query in a widget:

execution.crashes during past 1h
| summarize c1 = number_of_crashes.sum() by 15min
| asc start_time

Modified query:

execution.crashes <timepicker period>
| summarize c1 = number_of_crashes.sum() by <timepicker granularity>
| asc start_time

Object table with with or include clauses

Original query in a widget:

binaries
| with execution.crashes during past 1h
| summarize total = number_of_crashes.sum()

Modified query:

binaries
| with execution.crashes <timepicker period>
| summarize total = number_of_crashes.sum()

devices, users, and binaries tables

Original query in a widget:

devices
| summarize c1 = count()

Modified query:

devices <timepicker period>
| summarize c1 = count()

Applying granularity to a line chart NQL query

As mentioned above, the time granularity affects only the intervals displayed in the line charts. For all other chart types, granularity settings do not impact the query results. For instance, consider a dashboard containing the following widgets:

  • KPI displaying average CPU usage:

device_performance.events
| summarize c1 = cpu_usage.avg()
  • Line chart showing daily values of average CPU usage:

device_performance.events
| summarize c1 = cpu_usage.avg() by 15min

If you select the Last 24 hours option with the timeframe picker and set the granularity to By hour, the updated queries would be:

  • KPI:

device_performance.events during past 24h
| summarize c1 = cpu_usage.avg()
  • Line chart:

device_performance.events during past 24h
| summarize c1 = cpu_usage.avg() by 1h

Despite the line chart showing data points per hour, the KPI query would continue to return an average based on 15-minute bucket averages.

NQL examples

Refer to the Live Dashboards NQL examples documentation for more information.


RELATED TOPICS

Last updated