> For the complete documentation index, see [llms.txt](https://docs.nexthink.com/platform/llms.txt). Markdown versions of documentation pages are available by appending `.md` to page URLs; this page is available as [Markdown](https://docs.nexthink.com/platform/user-guide/using-finder-classic/monitoring-it-services-classic/following-the-evolution-of-a-service-classic.md).
# Following the evolution of a service (classic)
{% hint style="info" %}
Nexthink Finder is a Windows-only desktop application whose functionality is now available within the Nexthink web interface. Nexthink can now be used directly from a browser and most functions no longer require an additional desktop application.
{% endhint %}
[Observing service performance](/platform/user-guide/using-finder-classic/visualizing-system-activity-with-finder-classic/observing-service-performance-with-finder-classic.md) documentation explains how to interpret the service view in Finder. The Nexthink web interface offers you a different perspective on services, allowing you to see not only real-time data, but also longer time intervals for historical data and trend analysis.
## Adding a service dashboard to the Nexthink web interface
To add a service to the Nexthink web interface, simply create a dashboard for it. You can either add the dashboard to an existing service module or create a new one. Only modules of type *service* can hold service-based dashboards. Refer to [Custom Dashboards](/platform/user-guide/custom-dashboards-classic.md) documentation for more information.
To create a new service module:
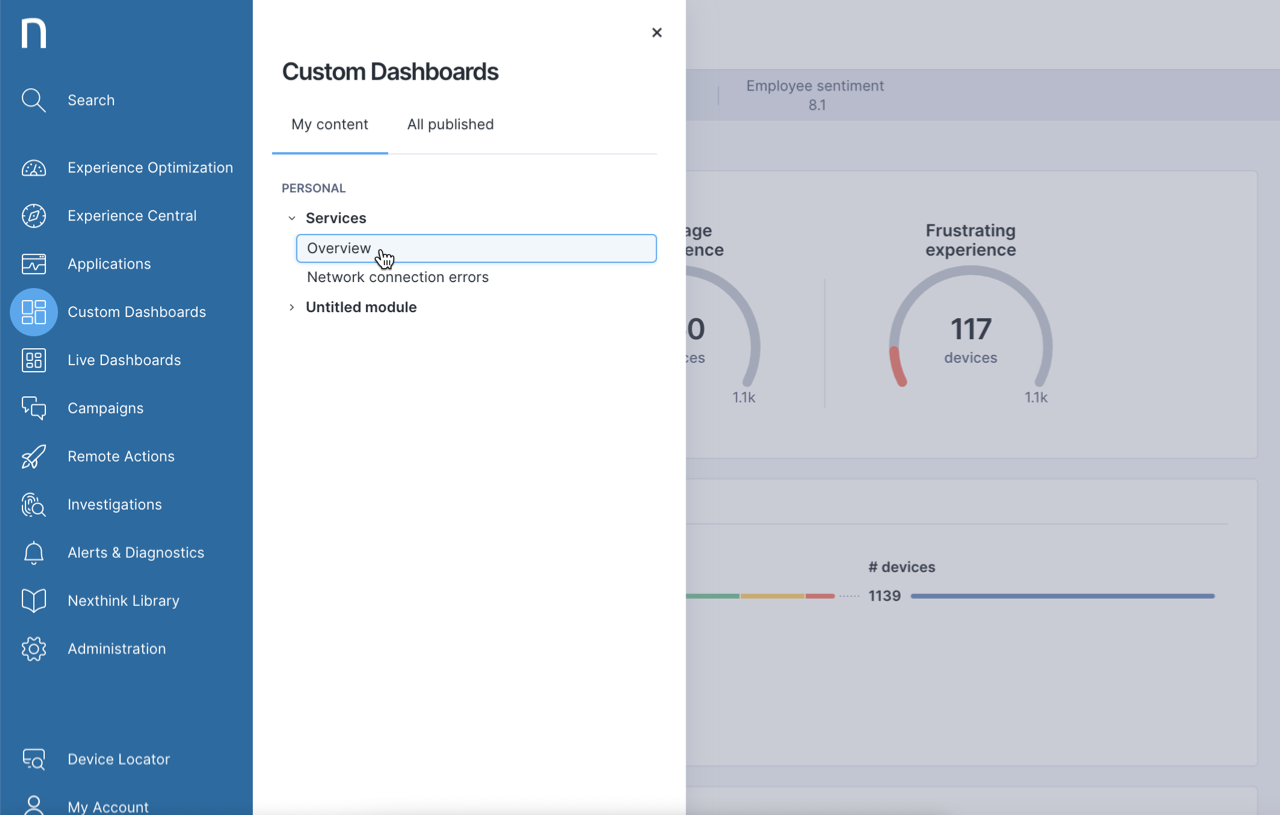
1. Select **Custom Dashboards** from the main menu.
2. Click on the **My content** tab.
3. Choose the **Overview** dashboard from the **Services** section.
4. Select the action menu at the top-right of the page.
5. Click on **Create new module...**.
6. Select **Service Monitoring** to create a new module for hosting services.
Once you have created a new service module or entered the configuration of an existing service module, add the desired service (or services) to it:
1. From the list of available services, select those you want to see in the module and click the button with the arrow pointing to the right. Services move from the **AVAILABLE** list to the **SELECTED** list.
2. Optional: If you selected some services by mistake, select them again and click the button with the arrow pointing to the left. Services move from the **SELECTED** list back to the **AVAILABLE** list.
3. Optional: All service modules have an **Overview** dashboard where you can see the list of all other dashboards in the module, each one representing a different service. Select how you want to arrange this list of services and their status breakdown, whether in rows or in columns, by setting the option **In overview dashboard, display services as *****rows***** / *****columns***.
4. To end adding the service (or services), click **Create**, if you are creating a new module, or **Done**, if you are modifying an existing module.
---
# Agent Instructions
This documentation is published with GitBook. GitBook is the documentation platform designed so that both humans and AI agents can read, navigate, and reason over technical content effectively. Learn more at gitbook.com.
## Querying This Documentation
If you need additional information that is not directly available in this page, you can query the documentation dynamically by asking a question.
Perform an HTTP GET request on the current page URL with the `ask` query parameter, and the optional `goal` query parameter:
```
GET https://docs.nexthink.com/platform/user-guide/using-finder-classic/monitoring-it-services-classic/following-the-evolution-of-a-service-classic.md?ask=&goal=
```
`ask` is the immediate question: it should be specific, self-contained, and written in natural language.
`goal` is optional and describes the broader end goal you are ultimately trying to accomplish on behalf of the user. GitBook uses it to tailor the answer towards what is most useful for that goal.
The response will contain a direct answer to the question and relevant excerpts and sources from the documentation.
Use this mechanism when the answer is not explicitly present in the current page, you need clarification or additional context, or you want to retrieve related documentation sections.