> For the complete documentation index, see [llms.txt](https://docs.nexthink.com/llms.txt). Markdown versions of documentation pages are available by appending `.md` to page URLs; this page is available as [Markdown](https://docs.nexthink.com/user-guide/using-finder-classic/monitoring-it-custom-metrics-with-finder-classic/following-the-evolution-of-a-metric-classic.md).
# Following the evolution of a metric (classic)
## Overview
After defining a metric in Finder, follow the evolution of its value from the web interface. Choose among different visualizations (*widgets*) for your metric.
To add metrics to the web interface, you must be a user with the right to create personal dashboards. If you do not have the right to create your own dashboards, you can still see the dashboards attributed to your roles.
## Adding a metric
To add a metric to the web interface, insert it into a dashboard. You may either reuse an existing dashboard or create a new one. In any case, the dashboard must belong to a module of type *Basic*.
Dashboards in Basic modules are initially empty, displaying just a blank page where you can add and organize widgets for your metrics. Combine several types of widgets in a dashboard to see your metrics from different points of view.
To create a new Basic module and dashboard:
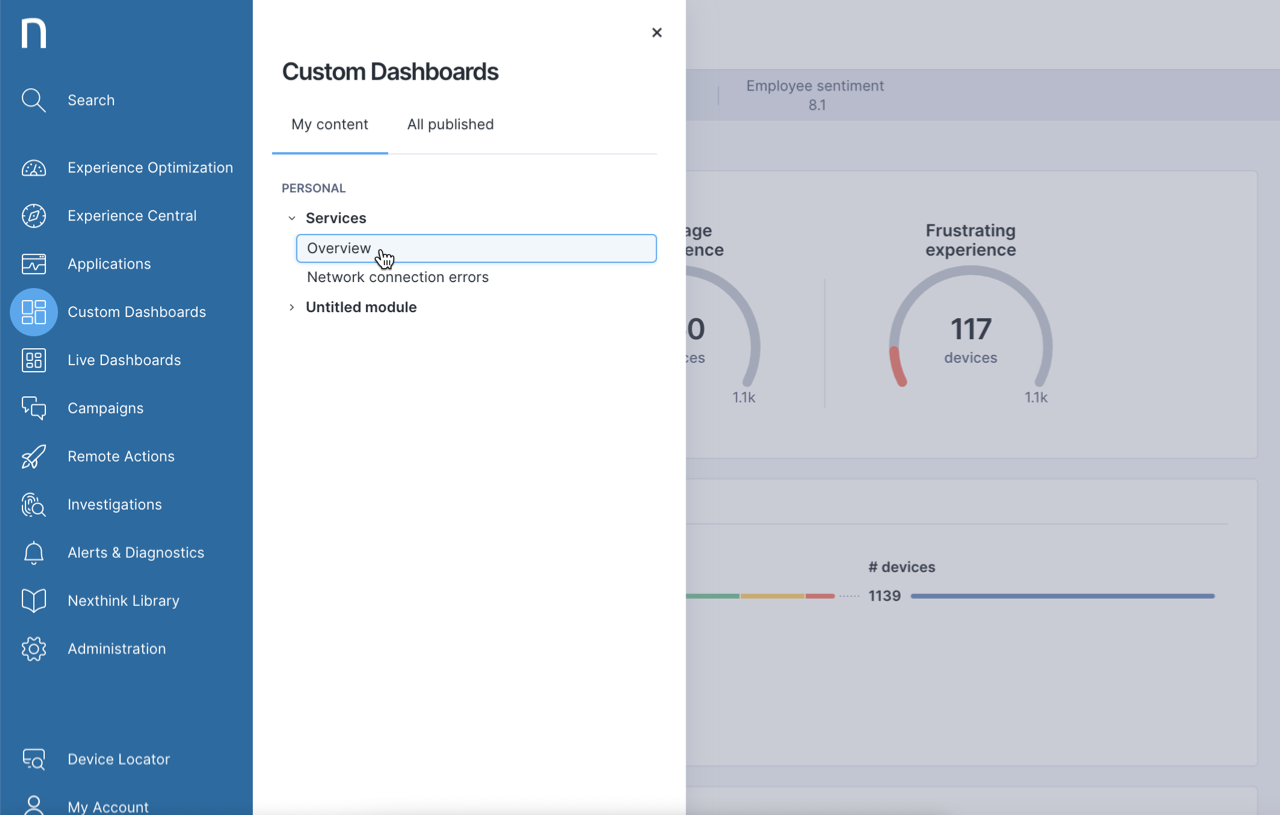
1. Select **Custom Dashboards** from the main menu.
2. Click on the **My content** tab.
3. Choose the **Overview** dashboard from the **Services** section.
4. Select the action menu at the top-right of the page.
5. Select **Create new module...** at the bottom of the menu.
6. Choose **Basic** as the type of module to create.
7. A new Basic module with a default empty dashboard will appear in your web interface.
8. (Optional) Rename the module and the dashboard (by default **Untitled module** and **Untitled dashboard**) by clicking the menu icon again and selecting **Rename...**.
1. Type in the new names for both the module and the dashboard under **Module name** and **Dashboard Name**.
2. Click **Done**.
Alternatively, choose an existing dashboard from the module navigation tool that you find on the left-hand side of the dark blue ribbon:
1. Click the module navigation tool (it displays the names of the current module and dashboard).
* If you have permission to see published content, and there actually are some modules published, you may see the rubrics **My content** and **All published**.
1. Click **My content** if this is the case.
2. Select a Basic module from the section **PERSONAL**. Only those modules that belong to you are available for editing.
* If you do not see the section **PERSONAL**, you do not have permission to create dashboards. Ask your administrator.
* If the **PERSONAL** section is empty of modules, it displays the message **No personal module. Click here to create one.**:
* Click the word **here** in the message to create your first personal module as an alternative to the method seen above.
* Select a dashboard from any of the other sections (dashboards included in your roles or under the **All published** rubric, if available) and copy it to your personal section in order to modify it:
1. Click the menu icon on the right-hand side of the blue ribbon once the dashboard is open.
2. Select **Copy module to my content** from the menu.
3. Select one of the available dashboards in the module.
Once you have either the new or the existing dashboard on your screen, add the metric to it:
1. Click the menu icon on the right-hand side of the dark blue ribbon.
2. Select **Edit content** in the **DASHBOARD** section. The dashboard is now in edit mode.
* If the dashboard was empty, a plus sign appears in it.
* If the dashboard has content, plus signs appear while you hover the cursor over the limits of existing widgets.
3. Click one of the plus signs to add a new widget for your metric at that location in the dashboard.
* Note that widgets can hold more than one metric. If you prefer to add your metric to an existing widget, click the sprocket icon that appears when you hover the cursor over the top-right corner of a widget and select **Edit**.
4. Choose the type of widget that you want to create:
* KPI.
* Table.
* Line chart.
* Bar chart.
5. Fill-in the dialog to add the widget:
1. (Optional) Type in a title for the widget.
2. Click the button **Add metrics**.
3. Select a metric from the list of available metrics.
4. Click the button **Add**. The list of metrics turns into a preview of the widget.
5. Depending on the type of widget that you’ve chosen, set the **DISPLAY** options.
6. (Optional) Click **Add metrics** again to add as many metrics as you want to the widget.
7. Click **Done** to finish editing the widget and come back to dashboard editing.
6. To finish editing the dashboard, click the check mark that replaces the menu icon on the right-hand side of the dark blue ribbon while in edit mode.
---
# Agent Instructions
This documentation is published with GitBook. GitBook is the documentation platform designed so that both humans and AI agents can read, navigate, and reason over technical content effectively. Learn more at gitbook.com.
## Querying This Documentation
If you need additional information that is not directly available in this page, you can query the documentation by asking a question.
Perform an HTTP GET request on the following URL with the `ask` and `goal` query parameters:
```
GET https://docs.nexthink.com/user-guide/using-finder-classic/monitoring-it-custom-metrics-with-finder-classic/following-the-evolution-of-a-metric-classic.md?ask=&goal=
```
`ask` is the immediate question: it should be specific, self-contained, and written in natural language.
`goal` is what the user is ultimately trying to achieve, the reason they need the answer. Sharing it helps GitBook give you a better, more relevant answer. A goal is most helpful when it describes the outcome the user wants rather than restating the question. For example, with `ask=how do I create an API token`, a goal like `automate deployments from our CI pipeline` lets GitBook tailor the answer to that use case.
The response will contain a direct answer to the question and relevant excerpts and sources from the documentation.
Use this mechanism when the answer is not explicitly present in the current page, you need clarification or additional context, or you want to retrieve related documentation sections.