# 単一のデバイスまたはユーザーに影響を与える問題の検出
{% hint style="info" %}
既存のアラートに関連付けられているデバイスを調査し照会する方法については、[アラート FAQ](https://docs.nexthink.com/platform/ja/user-guide/alerts-faq#how-can-i-investigate-and-query-devices-associated-with-an-existing-alert)を参照してください。NQLを使用しています。
{% endhint %}
単一のデバイスまたはユーザーで発生する問題を検出し、ユーザーがチケットを発行する前にL1サポートチームが積極的に対応し、修正するのを支援します。
単一のデバイスまたはユーザーごとにメトリクスを評価するモニターを構成するには、計算されたメトリクスのリストを返すNQLクエリを作成し、さらに集計せずに返します。 これを達成するための方法は2つあります:
1. `devices` または `users` テーブルを開始し、いずれかのテーブルをeventsテーブルと結合し、メトリクスを計算します。
{% code overflow="wrap" lineNumbers="true" %}
```
devices
| with device_performance.system_crashes during past 7d
| compute total_number_of_system_crashes = number_of_system_crashes.sum()
```
{% endcode %}
2. eventsテーブルを開始し、メトリクスを要約し、デバイスごとにグループ化を追加します。
{% code overflow="wrap" lineNumbers="true" %}
```
device_performance.system_crashes during past 7d
| summarize total_number_of_system_crashes = number_of_system_crashes.sum() by device.collector.uid
```
{% endcode %}
### **通知:**
システムは、影響を受けた各デバイスまたはユーザーごとに個別に通知を送り、ペイロードにデバイスまたはユーザー名を含めます。
### **Alerts overview ダッシュボード**
Alerts overview ダッシュボードでは、すべてのデバイス/ユーザーのアラートが組み合わされ、1行に表示されます。 影響を受けたデバイスの列には、アラートのあるデバイスの数が表示されます。
### **考慮事項**
* 多数のオブジェクトが一度にアラートをトリガーすることを予期している場合は、このタイプのクエリを使用しないでください。 Nexthink は、一つのモニターにつき最大500の同時トリガーを設定しています。 レポート用途で外部システムに対し、[データエクスポート](https://docs.nexthink.com/platform/ja/configuring_nexthink/bringing-data-into-your-nexthink-instance/integrating-nexthink-with-third-party-tools/outbound-connectors/data-exporters)や[ウェブフック](https://docs.nexthink.com/platform/ja/configuring_nexthink/bringing-data-into-your-nexthink-instance/integrating-nexthink-with-third-party-tools/outbound-connectors/webhooks)を使用することを検討してください。
* このタイプのクエリには `summarize... by device.name` 構文を使用しないでください。それは期待通りにデバイスごとのアラートをトリガーしません。
## NQL例
以下は、モニターを作成および編集する際に役立つNQLクエリの例です。 クエリを確認し、作成または編集しているモニターに最も似たものを選択してください。 クエリをコピーし、使用例に合わせて調整し、例として提供されたしきい値を含めてください。
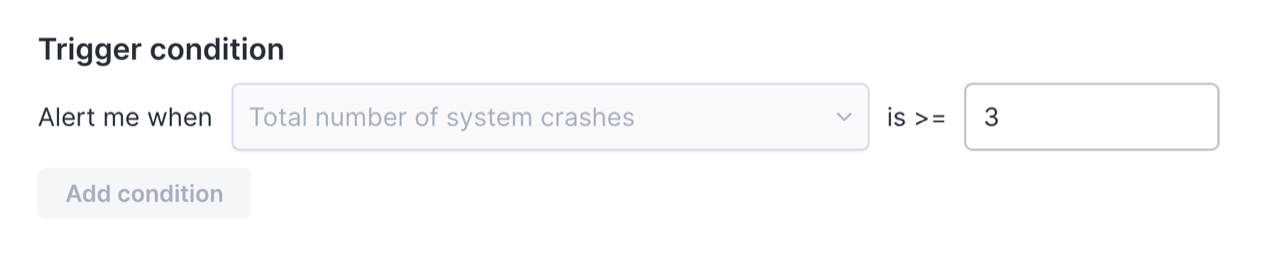
### 週あたりのシステムクラッシュ数が多いデバイス ( >=3)
このアラートはペイロードにデバイス名を含んだデバイスごとにトリガーされます。
{% code overflow="wrap" lineNumbers="true" %}
```
devices
| with device_performance.system_crashes during past 7d
| compute total_number_of_system_crashes = number_of_system_crashes.sum()
| sort total_number_of_system_crashes desc
```
{% endcode %}
または
{% code overflow="wrap" lineNumbers="true" %}
```
device_performance.system_crashes during past 7d
| summarize total_number_of_system_crashes = number_of_system_crashes.sum() by device.collector.uid
```
{% endcode %}
2つ目の例では、グループ化に `device.collector.uid` を使用してください。 システムは通知にデバイス名を送ります。
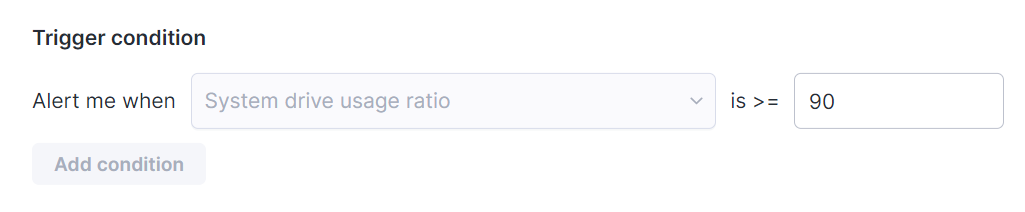
### 先週のシステムドライブ使用率が高いデバイス ( >=90)
このアラートはペイロードにデバイス名を含んだデバイスごとにトリガーされます。
{% code overflow="wrap" lineNumbers="true" %}
```
devices during past 7d
| include device_performance.events during past 7d
| compute system_drive_usage_ratio_ = event.system_drive_usage.avg()/event.system_drive_capacity.avg()*100
| list system_drive_usage_ratio_
```
{% endcode %}
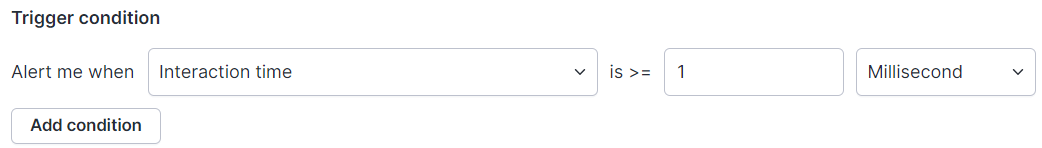
### Salesforceアプリへの不正アクセスユーザー
このアラートは、Salesforceアプリにアクセスし、マーケティングや営業部門に所属していないユーザーごとにトリガーされます。 アラートのペイロードにユーザー名が含まれています。
{% code overflow="wrap" lineNumbers="true" %}
```
users during past 1d
| include web.events during past 1d
| where application.name == "Salesforce"
| compute usage_time_ = event.duration.sum()
| include session.events during past 1d
| where device.organization.entity !in ["MarketingSales"]
| compute interaction_time_ = event.user_interaction_time.sum()
```
{% endcode %}
---
# Agent Instructions: Querying This Documentation
If you need additional information that is not directly available in this page, you can query the documentation dynamically by asking a question.
Perform an HTTP GET request on the current page URL with the `ask` query parameter:
```
GET https://docs.nexthink.com/platform/ja/user-guide/alerts-and-diagnostics/managing-alerts/creating-custom-monitors/detecting-issues-impacting-a-single-device-or-user.md?ask=
```
The question should be specific, self-contained, and written in natural language.
The response will contain a direct answer to the question and relevant excerpts and sources from the documentation.
Use this mechanism when the answer is not explicitly present in the current page, you need clarification or additional context, or you want to retrieve related documentation sections.