> For the complete documentation index, see [llms.txt](https://docs.nexthink.com/platform/llms.txt). Markdown versions of documentation pages are available by appending `.md` to page URLs; this page is available as [Markdown](https://docs.nexthink.com/platform/~/changes/Sh4xqs4GDClkDKT9Hvux/user-guide/investigations/visual-editor.md).

# Visual editor

Use the **Visual editor** to create powerful and flexible investigations without the need to write and master the NQL syntax from the NQL data model.

The Visual editor is a graphical NQL tool that allows you to:

* Use a table to list and visualize a collection of objects such as users, devices, binaries or events.
* Add additional columns with various properties and metrics.
* Fine-tune the results using conditions and filters based on properties and metric values.
* Switch between the **Visual editor** and [NQL editor](/platform/~/changes/Sh4xqs4GDClkDKT9Hvux/user-guide/investigations/nql-editor.md), or use both modes to build queries.

## Query data using the Visual editor <a href="#visualeditor-accessingthevisualeditor" id="visualeditor-accessingthevisualeditor"></a>

1. Select **Investigations** from the main menu to create or edit an existing investigation.
2. Under the **Visual editor**, use the **Display** drop-down menu to select an option from the available data:
   * Objects tables such as **Users**, **Devices** and **Binaries**.
   * Events tables such as **Execution crashes** and **Device performance events**.
3. After choosing an option from the **Display** drop-down, a set of default columns appears in the results table.
   * The **Visual editor** displays the **Devices** result table by default.
   * The metrics in the **Display** drop-down under **Campaigns** and **Remote actions** have an extra drop-down to target specific campaigns and remote actions. See the image below.&#x20;
   * To modify the columns in the results table, refer to the [Adding fields](#visualeditor-addingfieldstoaninvestigationaddingfields), [conditions](#visualeditor-addingconditionstoametricfieldaddingconditions) and [filters](#visualeditor-filteringinvestigationresultsaddingfilters) sections on this page.

{% hint style="warning" %}
Jump to the [Visual editor unsupported NQL statements](#visualeditor-visualeditorunsupportednqlstatements) to identify the NQL data incompatible with the visual builder.&#x20;
{% endhint %}

<figure><img src="https://268444917-files.gitbook.io/~/files/v0/b/gitbook-x-prod.appspot.com/o/spaces%2FxJSUDk9NTtCHYPG5EWs3%2Fuploads%2FZ65ZyjdZseGo1Bbf8U16%2FInvestigations-171939524588.png?alt=media&amp;token=bda8d561-5a32-47de-82f0-9acfd493c2c4" alt="Choosing an option from the Display drop-down in a investigations."><figcaption></figcaption></figure>

### Selecting connection events for Network view <a href="#visualeditor-selectingconnectioneventsfornetworkview" id="visualeditor-selectingconnectioneventsfornetworkview"></a>

Choosing **Connection events** from the **Display** drop-down of the Visual editor on the Investigations page enables the **Network** tab with a Network view visualization.

{% hint style="info" %}
Refer to the [Network view](/platform/~/changes/Sh4xqs4GDClkDKT9Hvux/user-guide/network-view.md) documentation to learn how to identify and troubleshoot network-related issues.
{% endhint %}

## Adjusting the timeframe from the Visual Editor <a href="#visualeditor-adjustingthetimeframe" id="visualeditor-adjustingthetimeframe"></a>

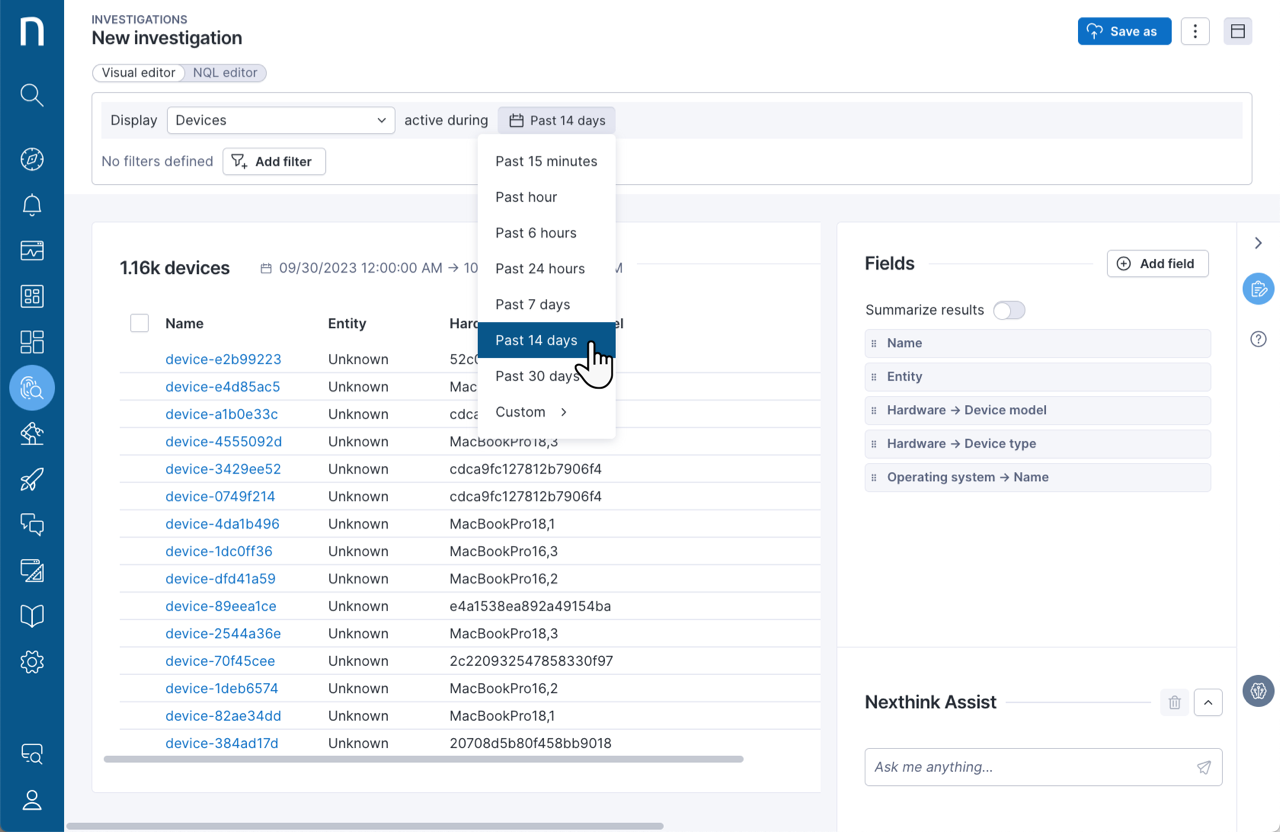
From the **Visual editor** on the Investigations page, select a timeframe from the **active during** drop-down.

The timeframe is set to **Past 7 days** by default.

Unlike in the [NQL editor](/platform/~/changes/Sh4xqs4GDClkDKT9Hvux/user-guide/investigations/nql-editor.md), the timeframe selection is mandatory to query objects and events in the Visual editor.

<figure><img src="https://268444917-files.gitbook.io/~/files/v0/b/gitbook-x-prod.appspot.com/o/spaces%2FxJSUDk9NTtCHYPG5EWs3%2Fuploads%2Fgit-blob-22e94a1bf0bccf7534b62f20e79271231c1296ab%2Finv-1697199132.png?alt=media" alt="Timeframe" width="760"><figcaption></figcaption></figure>

### Timeframe for events <a href="#visualeditor-timeframeforevents" id="visualeditor-timeframeforevents"></a>

The system limits the results to events within the selected time period.

### Timeframe for objects <a href="#visualeditor-timeframeforobjects" id="visualeditor-timeframeforobjects"></a>

The system limits the results to the active inventory within the selected timeframe. This means the system outputs objects detected during the selected timeframe.

The selected timeframe automatically applies across metric columns computed for a given object.

{% hint style="info" %}
The source collection and computed metric have the same timeframe.
{% endhint %}

The following is an example of the NQL syntax used by the Visual editor:

```
devices during past 7d 
| include execution.crashes during past 7d 
| compute number_of_crashes__0 = crash.number_of_crashes.sum()
```

## Using the Visual editor result table for insights <a href="#visualeditor-usingtheinvestigationresulttableforinsights" id="visualeditor-usingtheinvestigationresulttableforinsights"></a>

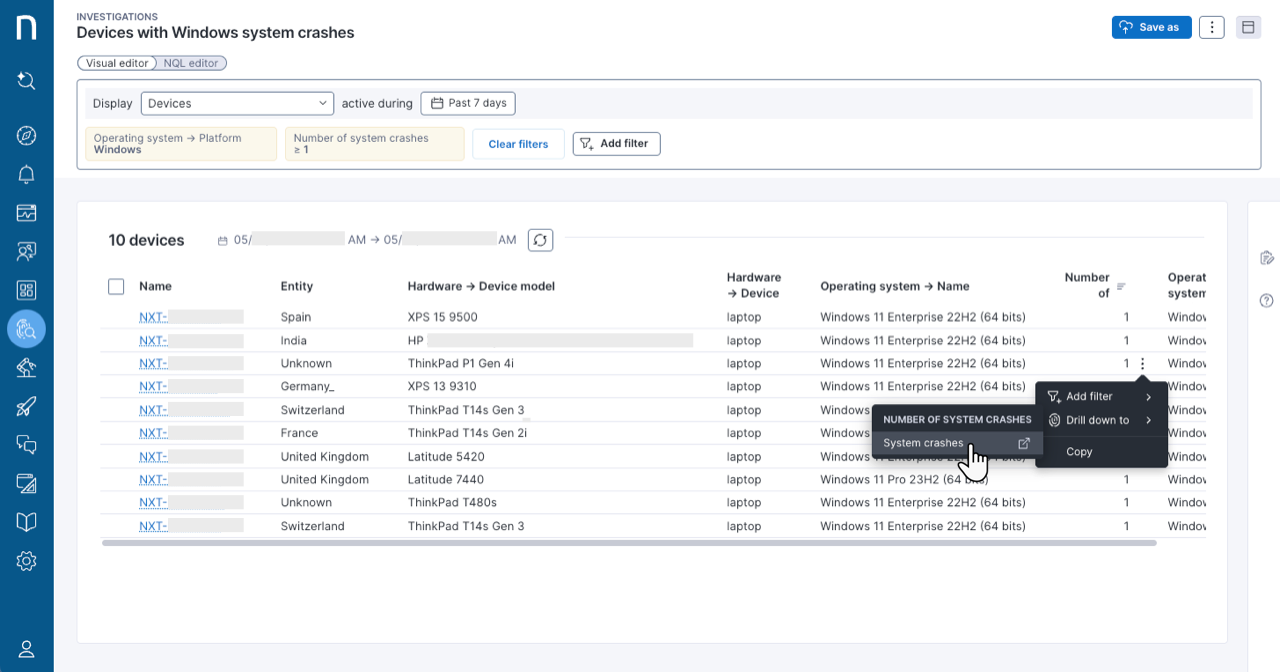
Hover over a specific cell value in the investigation results table, to open the action menu and access different options depending on the field:

* **Drill down to …** opens an Investigation page with the NQL query listing the results specific to the row of the selected cell value under the field column of interest. See the image below.
  * The **Drill down to...** option is available for field metric values.
* **Copy** value or **Copy raw value**. Remember, the system shortens large numbers with appropriate suffixes. Hover over a metric to see the raw number.
* Use the contextual action menu only for inventory objects—users, devices and binaries—to:
  * **Open binary profiling, Open user overview** or **Open device view**, depending on the case.
  * **Diagnose** for diagnostics dashboards.
  * **Retrieve all** pre-filled investigation queries in the inventory-object context.

#### Action bar for bulk operations <a href="#visualeditor-actionbar" id="visualeditor-actionbar"></a>

Additionally, when you select entire rows by ticking the checkboxes on the left of the table, the system displays an action bar at the bottom of the Nexthink web interface.

Depending on the selected cell item, the action bar includes the action menu options listed above, plus the possibility to **Execute action**, **Edit** or **Launch campaigns**.

<figure><img src="https://268444917-files.gitbook.io/~/files/v0/b/gitbook-x-prod.appspot.com/o/spaces%2FxJSUDk9NTtCHYPG5EWs3%2Fuploads%2Fgit-blob-9cbbe72e1590532966860aff74b074f3035c147b%2Fmanaging-investigations-1716897400.png?alt=media" alt="Drilling down investigation result table." width="760"><figcaption></figcaption></figure>

## Adding fields to an investigation from the Visual editor <a href="#visualeditor-addingfieldstoaninvestigationaddingfields" id="visualeditor-addingfieldstoaninvestigationaddingfields"></a>

To change the displayed columns in the investigation results from the Investigations page > **Visual editor**:

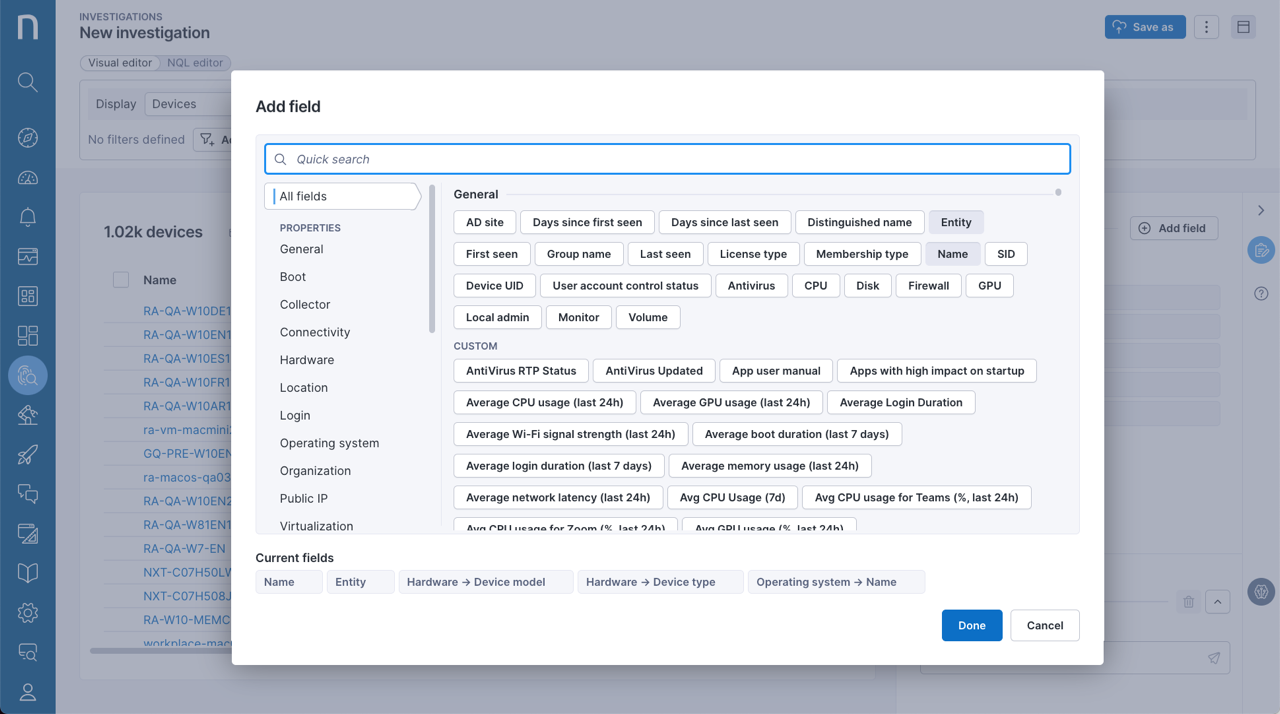
1. Click the **Add field** button in the **Fields** right-side panel to open the **Add field** pop-up.
2. Search for or choose field metrics and properties available from the source collections and associated collections.
   * The system organizes available metrics and properties into categories.
   * The system displays selected fields under **Current fields**. If needed, remove any field.
3. Depending on the selected field, the system opens a pop-up to **Add condition**. Refer to the [Adding conditions to a field](#visualeditor-addingconditionstoametricfieldaddingconditions) section on this page.
4. Click **done** to add all selected fields and subsequently, change the displayed columns in the Investigation results table. See the image below.

The system uses the default aggregation after you add a field column. The Visual editor does not currently support changing the default aggregation. See the [Summarizing investigation results](#visualeditor-summarizinginvestigationresultstrue) section on this page.

[Switch to the NQL editor](#visualeditor-switchingfromvisualeditortonqleditorswitchtonql) to check the active aggregation method. For example, the `sum` aggregation function applied to the selected metric for the `number_of_crashes`:

```
devices during past 7d
| include execution.crashes during past 7d
| compute number_of_crashes__0 = crash.number_of_crashes.sum()
| list device.entity, device.hardware.model, device.hardware.type, device.operating_system.name, number_of_crashes__0
```

<figure><img src="https://268444917-files.gitbook.io/~/files/v0/b/gitbook-x-prod.appspot.com/o/spaces%2FxJSUDk9NTtCHYPG5EWs3%2Fuploads%2Fgit-blob-8b1b827956a41c163c576b6657759d2cd5eec092%2Finv-1697441152.png?alt=media" alt="Adding a field modal" width="760"><figcaption></figcaption></figure>

### Adding conditions to a metric field <a href="#visualeditor-addingconditionstoametricfieldaddingconditions" id="visualeditor-addingconditionstoametricfieldaddingconditions"></a>

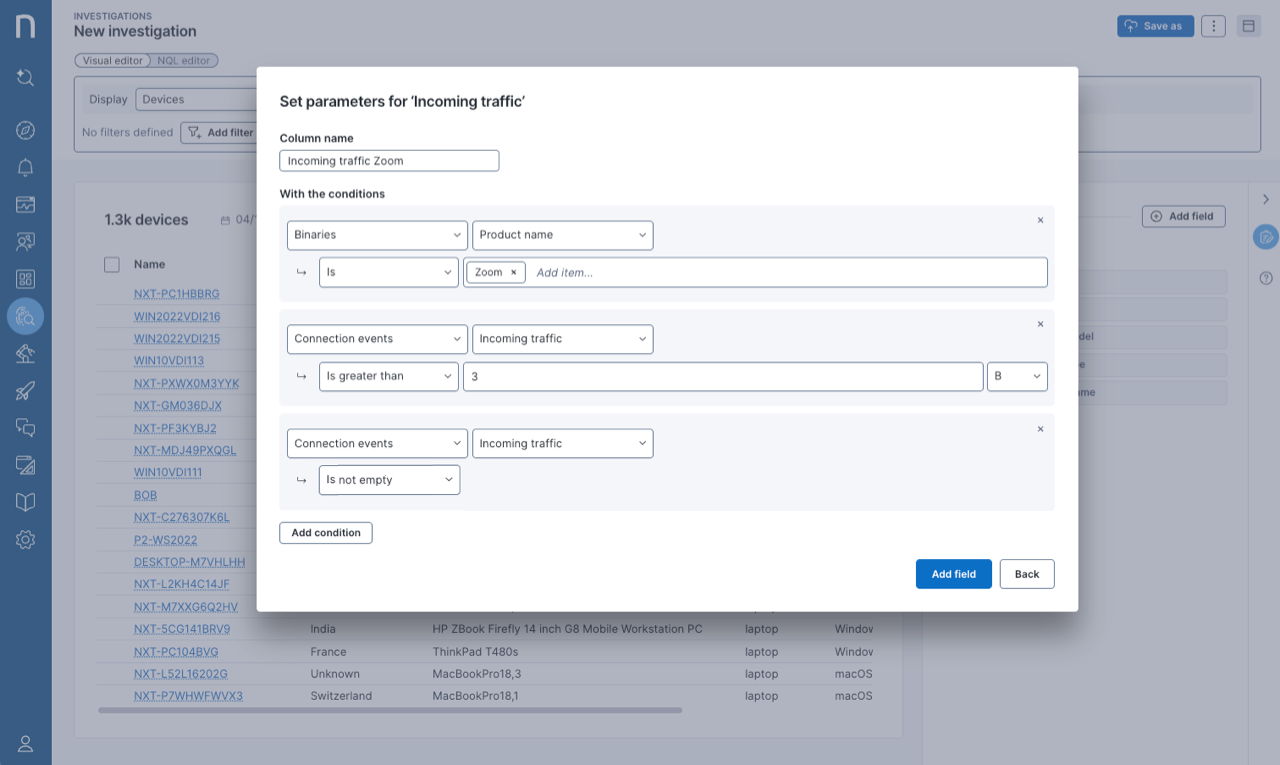
The following steps show an example of adding condition values to the **Incoming traffic** field for different binaries:

1. Click the **Add field** button in the **Fields** right-side panel on the Investigations page > **Visual editor** to open the **Add field** pop-up.
   * Alternatively, you can right-click an existing field to **Edit**.
2. In this example, you create two separate columns to display incoming traffic from the **skype** and **Zoom** binaries. Therefore, you must repeat these steps for each binary:
   * Select the **Incoming traffic** field to **add conditions** on the **skype** or **Zoom** binary.
   * **Add condition**(s) to restrict the metric value of the **Incoming traffic**.
   * Save the condition-specific field under a unique **Column name**.

See the image below for a visual representation.

#### **Field conditions considerations**

* Adding multiple conditions automatically adds the `and` logical operator between them.
* Adding multiple metric values or properties to the same condition automatically adds the `or` logical operator.
* The autocomplete feature suggests existing property values. If needed, use wildcards:
  * `*` to substitute for zero or more characters
  * `?` to substitute for zero or one character

<figure><img src="https://268444917-files.gitbook.io/~/files/v0/b/gitbook-x-prod.appspot.com/o/spaces%2FxJSUDk9NTtCHYPG5EWs3%2Fuploads%2Fgit-blob-00977268bf374e25f23a5bfc19076df524fa2259%2F1713964772-1713961612.png?alt=media" alt="1713964772-1713961612.png" width="760"><figcaption></figcaption></figure>

## Filtering investigation results from the Visual editor  <a href="#visualeditor-filteringinvestigationresultsaddingfilters" id="visualeditor-filteringinvestigationresultsaddingfilters"></a>

To filter investigation results, you have the following options:

* **Add filter** button from the **Visual edito**r on the Investigations page.
* **Add filter…** from the action menu of a selected item to apply its value or property as a filter to the entire field column.
* **Add filter…** from the action menu of a column header or a specific field in the right-side panel to **set filter** values to the entire field column.

The system lists added filters next to the **Add filter** button on the Investigations page. Right-click on an added filter to **Edit** or **Remove** the filter.

{% hint style="info" %}
The Visual editor loads and displays **Advanced filters** and complex conditions created  created in the NQL editor. This includes, for example, queries with `or` operators and nested `and` combinations. \
Switch back to the [NQL editor](#visualeditor-switchingfromvisualeditortonqleditorswitchtonql) to edit advanced filters.
{% endhint %}

#### Example of adding filters from the Add filter button <a href="#visualeditor-exampleofaddingfiltersfromtheaddfilterbutton" id="visualeditor-exampleofaddingfiltersfromtheaddfilterbutton"></a>

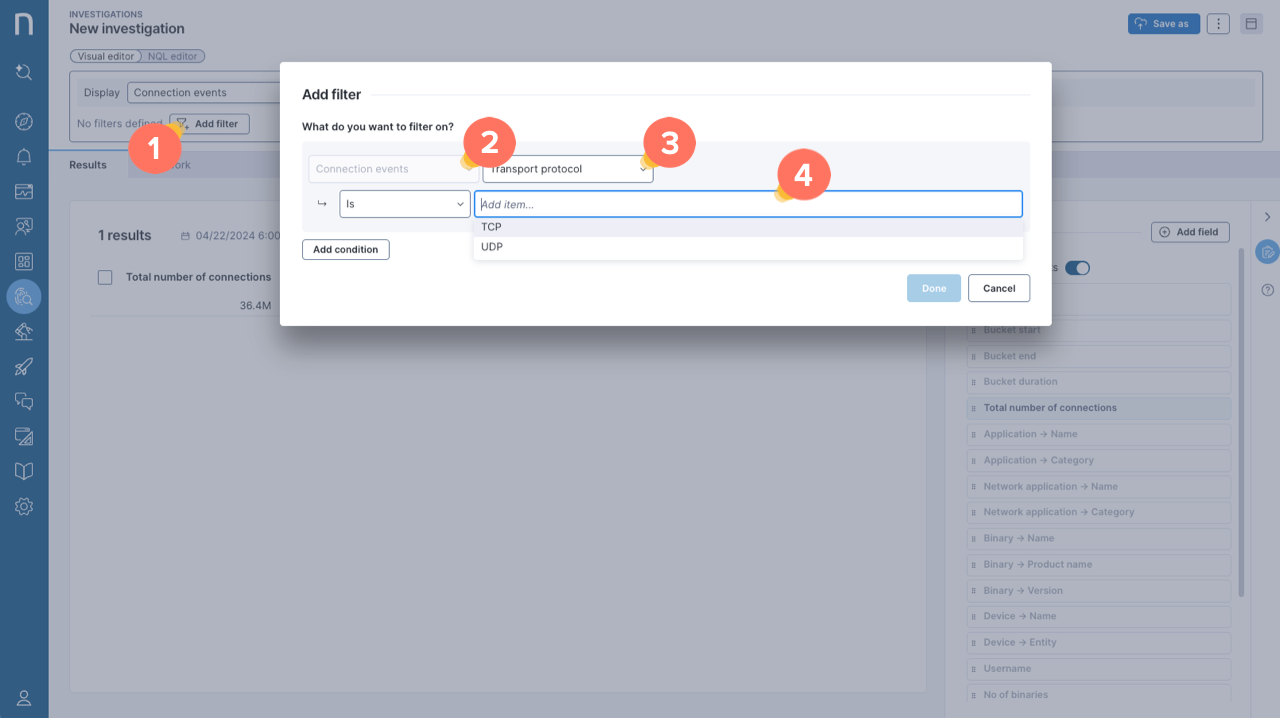
The example below describes the steps for adding a **TCP** filter to a **Connection events** investigation result:

1. Click the **Add filter** button from the Visual editor on the Investigations page to open the **Add filter** pop-up.
2. Select **Connection events** from the first drop-down.
3. Select or search **Transport protocol** from the second drop-down.
4. Select the `is` operation and add **TCP** as the item.
   * Optionally, add multiple conditions.
5. Click **done** to save the filter.

<figure><img src="https://268444917-files.gitbook.io/~/files/v0/b/gitbook-x-prod.appspot.com/o/spaces%2FxJSUDk9NTtCHYPG5EWs3%2Fuploads%2Fgit-blob-839f1a7d115e86e31b8ab4efd21ece019f136364%2Fvisualeditor-1713949565.png?alt=media" alt="Add filter button in the visual editor." width="760"><figcaption></figcaption></figure>

#### Example of adding filters from an investigation item <a href="#visualeditor-exampleofaddingfiltersfromaninvestigationitem" id="visualeditor-exampleofaddingfiltersfromaninvestigationitem"></a>

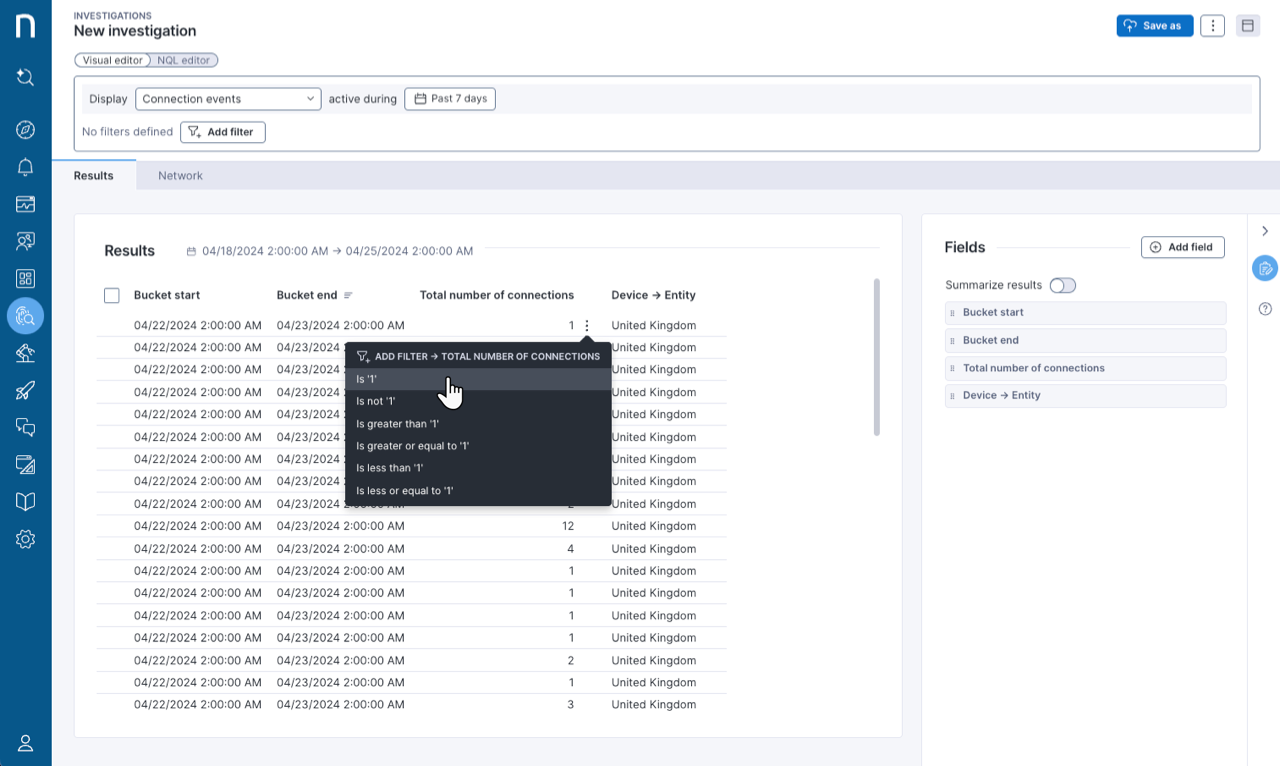
The example below describes the steps for adding a `is '1'` filter to the **Total number of connections** field directly from an investigation result item.

1. Right-click on the desired item metric value from the results table to open the action menu. In this example, the value of `1` under the **Total number of connections** field column.
2. From the **Add filter…** action menu of a selected item, click the `is '1'` and filter the entire field column to show that item value.

<figure><img src="https://268444917-files.gitbook.io/~/files/v0/b/gitbook-x-prod.appspot.com/o/spaces%2FxJSUDk9NTtCHYPG5EWs3%2Fuploads%2Fgit-blob-53ea5873f10127970612a6f829a41f99b8e6277f%2Fvisualeditor-1713951367.png?alt=media" alt="Adding filters from an investigation item." width="760"><figcaption></figcaption></figure>

#### Example of adding filters from field columns <a href="#visualeditor-exampleofaddingfiltersfromfieldcolumns" id="visualeditor-exampleofaddingfiltersfromfieldcolumns"></a>

The example below describes the steps for setting a filter value on the **Total number of connections** field directly from the Investigations field header.

From the Investigations page > **Visual editor**:

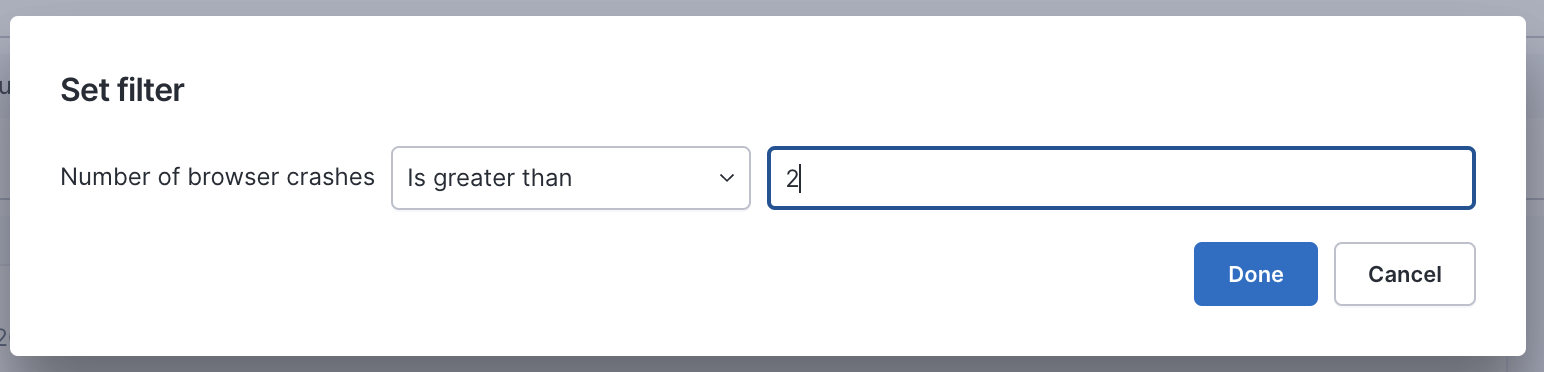
1. Right-click on the field column header from the results table to open the action menu. In this example, the **Total number of connections** field column from the **Connection events** investigation result.
2. Click the **Add filter…** option from the column header action menu to open the **Set filter** pop-up. Choose the condition operator and one or multiple values for the conditions. In this case, `Is greater than '2'`.

<figure><img src="https://268444917-files.gitbook.io/~/files/v0/b/gitbook-x-prod.appspot.com/o/spaces%2FxJSUDk9NTtCHYPG5EWs3%2Fuploads%2Fgit-blob-d8f8e2b5f0c81d23fae1d1e15d7043b9c4d1a7d5%2Fimage-20230522-150110.png?alt=media" alt="" width="544"><figcaption></figcaption></figure>

## Summarizing investigation results from the Visual editor <a href="#visualeditor-summarizinginvestigationresultstrue" id="visualeditor-summarizinginvestigationresultstrue"></a>

The summarize mode in the **Visual editor** allows you to aggregate and break down investigation metrics and properties into groups and time periods.

To activate the summarize mode from the Investigations page > **Visual editor**, choose one of these options:

* Enable the **Summarize results** toggle button in the **Fields** right-side panel.
* Right-click the field column header from the Investigations results table to open the action menu and select the **Summarize** option.

Exit summarize mode by disabling the **Summarize results** toggle button.

#### Adding fields in summarize mode <a href="#visualeditor-addingfieldswheninsummarizemode" id="visualeditor-addingfieldswheninsummarizemode"></a>

When [adding fields](#visualeditor-addingfieldstoaninvestigationaddingfields) in summarize mode from the Investigations page > **Visual editor,** consider the following:

* The system adds properties of supported data types (string, UID, Boolean, enumeration, version) to the results list as a `group by` field.
* The system adds metrics to the results list and aggregates the data by default.

#### Adding filters when in summarize mode <a href="#visualeditor-addingfilterswheninsummarizemode" id="visualeditor-addingfilterswheninsummarizemode"></a>

When [adding filters](#visualeditor-addingfilterswheninsummarizemode) in summarize mode from the Investigations page > **Visual editor**, consider the following:

* Filters on properties used in the `group by` are reflected in the results.
* Filters on metric numerical values still affect the Investigations results table after disabling the **Summarize results** toggle button.

{% hint style="info" %}
Overall, the system aggregates metric numerical values, but clusters properties using the `group by` clause for supported data types (string, UID, Boolean, enumeration, version).
{% endhint %}

### Visualizing investigation results as a line chart in summarize mode

To see investigation results as a line chart visualization, from the Investigations page > **Visual editor**:

1. Enable the **Summarize results** toggle button in the **Fields** right-side panel.
2. Click on the eye icon in the **Start time** field in the right-side panel, to show the results by days.&#x20;
3. Once the summarized results are displayed by days, click the **Toggle to chart view** button.

<figure><img src="https://268444917-files.gitbook.io/~/files/v0/b/gitbook-x-prod.appspot.com/o/spaces%2FxJSUDk9NTtCHYPG5EWs3%2Fuploads%2FMbjc3xzufkABvVIYrSzM%2FVisualEditor-1719844069.png?alt=media&amp;token=6c98f14b-fe94-41b6-be78-8761b58e2206" alt="Line chart visualization from the Visual Editor. "><figcaption></figcaption></figure>

## Saving an investigation from the Visual editor <a href="#visualeditor-savinganinvestigation" id="visualeditor-savinganinvestigation"></a>

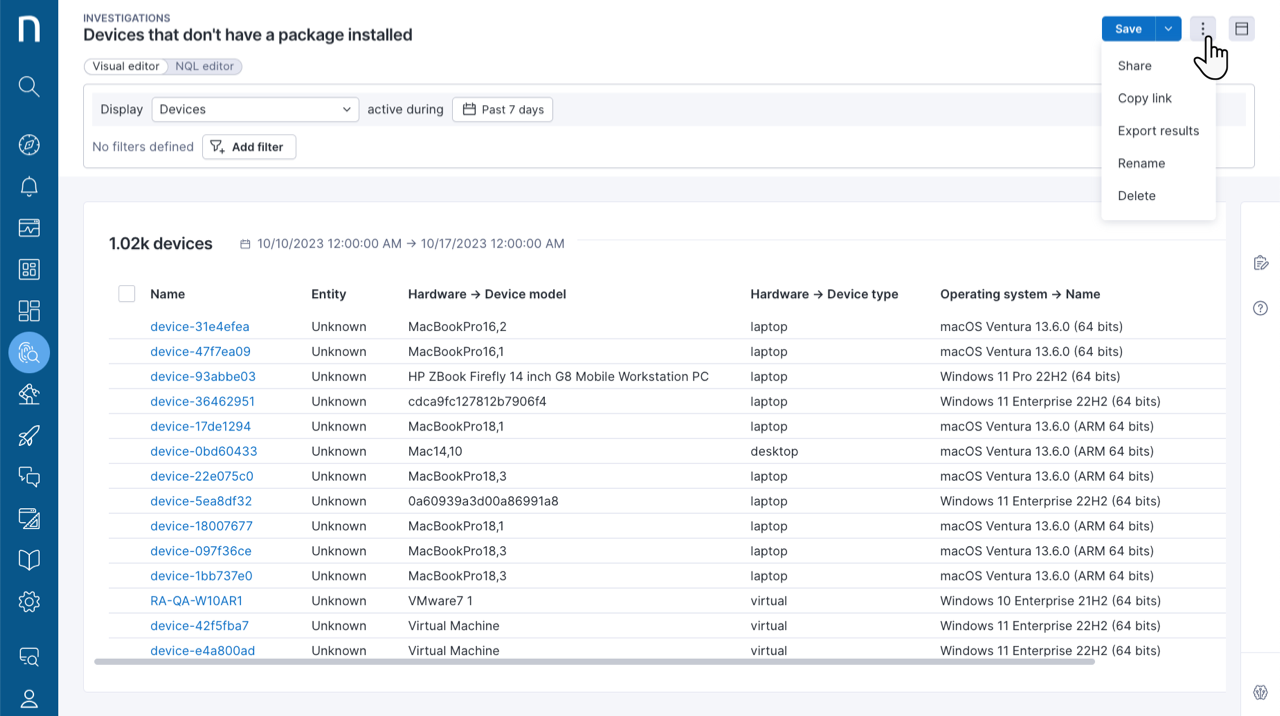
Click on the **Save as** button in the top-right corner of the Investigations page to save an investigation.

Saved investigations appear on the [Manage Investigations](/platform/~/changes/Sh4xqs4GDClkDKT9Hvux/user-guide/investigations/managing-investigations.md) page and in the navigation panel for the Investigations module.

If you are editing an existing investigation, you can:

* Click **Save** to save the changes.
* Click **Save as** to save the investigation under a different name.

<figure><img src="https://268444917-files.gitbook.io/~/files/v0/b/gitbook-x-prod.appspot.com/o/spaces%2FxJSUDk9NTtCHYPG5EWs3%2Fuploads%2Fgit-blob-c3718d3cb7e5aab035ea30c204827e9715f8279d%2Finv-1697449801.png?alt=media" alt="Investigations page action menu" width="760"><figcaption></figcaption></figure>

## Sharing and exporting an investigation from the Visual editor <a href="#visualeditor-sharingandexportinganinvestigation" id="visualeditor-sharingandexportinganinvestigation"></a>

Click on the action menu in the top-right corner of the Investigations page to:

* **Share** an investigation with groups of users based on their user profile, and collaborate with them on an investigation. Grant permissions to other users to view or edit the investigation. Refer to the *Sharing an investigation* section of the [Manage Investigations](/platform/~/changes/Sh4xqs4GDClkDKT9Hvux/user-guide/investigations/managing-investigations.md) documentation for more information.
* **Copy link** to an investigation and share it with other Nexthink users. Copy link shares the query text in the URL and is always treated as a new investigation for the user you send the link to.
* **Export results** of the data returned by the investigation in a CSV file.
  * By default, the Visual editor limits the maximum number of query results to 10,000 rows on the webpage. The export to CSV feature returns up to 1,000,000 rows.
  * Ticking the **Formatted data** checkbox from the **Export results in the CSV** pop-up, allows you to format **Raw data**. Open the table below for more details.

{% hint style="info" %}
**Rename** or **Delete** an existing investigation using the same action menu from the Investigations page.
{% endhint %}

### Exporting Formatted data versus Raw data

This table displays the differences between exporting **Raw data** and **Formatted data** for most data types.

<table><thead><tr><th>Data type</th><th>Example of Raw data</th><th>Example of Formatted data</th></tr></thead><tbody><tr><td>bool/bool</td><td><p>0</p><p>1</p></td><td><p>No</p><p>Yes</p></td></tr><tr><td>bytes/bytes</td><td>5109928912799</td><td>4.65 TB</td></tr><tr><td>jsontype[]/device/antivirus</td><td><pre class="language-json" data-overflow="wrap"><code class="lang-json">[{"name":"Cortex XDR‚Ñ¢ Advanced Endpoint Protection","realTimeProtection":2,"upToDate":2},{"name":"Microsoft Defender Antivirus","realTimeProtection":3,"upToDate":2}]
</code></pre></td><td>Cortex XDR™ Advanced Endpoint Protection;<br>Microsoft Defender Antivirus</td></tr><tr><td>jsontype[]/device/cpu</td><td><pre class="language-json" data-overflow="wrap"><code class="lang-json">[{"name":"Apple M1 Pro","numberOfCores":10,"numberOfLogicalCpus":10}]
</code></pre></td><td>Apple M1 Pro</td></tr><tr><td>jsontype[]/device/disk</td><td><pre class="language-json" data-overflow="wrap"><code class="lang-json">[{"name":"APPLE SSD AP1024R","type":3,"bootDisk":true,"size":1.00055561E12}]
</code></pre></td><td>APPLE SSD AP1024R</td></tr><tr><td>jsontype[]/device/firewall</td><td><pre class="language-json" data-overflow="wrap"><code class="lang-json">[{"name":"Windows Firewall","realTimeProtection":2}]
</code></pre></td><td>Windows Firewall</td></tr><tr><td>jsontype[]/device/gpu</td><td><pre class="language-json" data-overflow="wrap"><code class="lang-json">[{"name":"NVIDIA Quadro P520","ram":"2147483648"},{"name":"Intel UHD Graphics","ram":"1073741824"}]
</code></pre></td><td>NVIDIA Quadro P520;<br>Intel UHD Graphics</td></tr><tr><td>jsontype[]/device/local_admin</td><td><pre class="language-json" data-overflow="wrap"><code class="lang-json">[{"name":"Kanopy@KAN-HDKTYD3","type":1},{"name":"localadmin@KAN-HDKTYD3","type":1}]
</code></pre></td><td>Kanopy@KAN-HDKTYD3;<br>localadmin@KAN-HDKTYD3</td></tr><tr><td>jsontype[]/device/monitor</td><td><pre class="language-json" data-overflow="wrap"><code class="lang-json">[{"name":"DELL","serialNumber":"D1CLSS2-4133544C","vendor":"DEL","manufacturingYear":2019,"maxHorizontalResolution":1920,"maxVerticalResolution":1080,"diagonalSize":27.1},{"name":"Wide viewing angle \u0026 High density FlexView Display 1920x1080","vendor":"LEN","manufacturingYear":2018,"maxHorizontalResolution":1920,"maxVerticalResolution":1080,"diagonalSize":13.9}]
</code></pre></td><td>DELL;<br>Wide viewing angle &#x26; High density FlexView Display 1920x1080</td></tr><tr><td>jsontype[]/device/volume</td><td><pre class="language-json" data-overflow="wrap"><code class="lang-json">[{"name":"disk0s1","size":5.24288E8,"usage":0.232,"freeSpace":4.02653184E8,"mount":"disk0s1"},{"name":"disk0s2","system":true,"size":4.94384808E11,"usage":0.9055235,"freeSpace":4.6707769E10,"mount":"disk0s2"},{"name":"disk0s3","size":5.3686641E9,"usage":1.0,"mount":"disk0s3"}]
</code></pre></td><td>disk0s1;<br>disk0s2;<br>disk0s3</td></tr><tr><td>numeric/duration</td><td>900</td><td>15min</td></tr><tr><td>numeric/float</td><td>4997.0634765625</td><td>5k</td></tr><tr><td>numeric/long</td><td>4111</td><td>4111</td></tr><tr><td>numeric/integer</td><td>3462</td><td>3.46k</td></tr><tr><td>numeric/numeric</td><td>65287</td><td>65287</td></tr><tr><td>string/bytes</td><td>xdt7cS8oDDrk9zGtfV6hcQ==</td><td>xdt7cS8oDDrk9zGtfV6hcQ==</td></tr><tr><td>string/datetime</td><td>2024-02-23 17:45:00</td><td>23/02/2024 17:45:00</td></tr><tr><td>string/ipAddress</td><td>192.168.1.23</td><td>192.168.1.23</td></tr><tr><td>string/ipAddressArray</td><td>::ffff:62.2.17.60,::ffff:62.2.24.162</td><td>::ffff:62.2.17.60::ffff:62.2.24.162</td></tr><tr><td>string/jsonArrayString</td><td><pre class="language-json" data-overflow="wrap"><code class="lang-json">["Appinfo","NaturalAuthentication","TokenBroker","UserManager","XblGameSave","shpamsvc"]
</code></pre></td><td>Appinfo, NaturalAuthentication, TokenBroker, UserManager, XblGameSave, shpamsvc</td></tr><tr><td>string/string</td><td>NXT-FVFWW2RZHV2H</td><td>NXT-FVFWW2RZHV2H</td></tr><tr><td>string/uuid</td><td>a8572a66-e312-4bda-9515-9b9666555aa4</td><td>a8572a66-e312-4bda-9515-9b9666555aa4</td></tr><tr><td>string/version</td><td>[10,0,22000,653]</td><td>10.0.22000.653</td></tr></tbody></table>

## Switching from Visual editor to NQL editor <a href="#visualeditor-switchingfromvisualeditortonqleditorswitchtonql" id="visualeditor-switchingfromvisualeditortonqleditorswitchtonql"></a>

Investigations created in the Visual editor always have an associated NQL query that you can view by switching to the **NQL editor** tab, and vice-versa for supported cases.

The system alerts you if the Visual editor does not support modifications typed into the NQL editor.

<figure><img src="https://268444917-files.gitbook.io/~/files/v0/b/gitbook-x-prod.appspot.com/o/spaces%2FxJSUDk9NTtCHYPG5EWs3%2Fuploads%2Fgit-blob-2cbf890eb59a9e60e379145efe0b8d9e8065dd2f%2Finv-1697443267.png?alt=media" alt="Incompatible NQL query message" width="760"><figcaption></figcaption></figure>

### Visual editor unsupported NQL statements <a href="#visualeditor-visualeditorunsupportednqlstatements" id="visualeditor-visualeditorunsupportednqlstatements"></a>

The following features are not supported by the visual builder:

* [Arithmetic operators](/platform/~/changes/Sh4xqs4GDClkDKT9Hvux/user-guide/nexthink-query-language-nql/nql-operators/nql-arithmetic-operators.md).
* `with` statement (all metrics from associated events are added using `include`).
* `sort` statement on multiple columns.
* `limit` statement.
* `as()` function.
* `contains` comparator. For example: `events during past 7d | where primary_physical_adapter . dns_ips contains 156.64.0.39 / 255`&#x20;
* `custom_trend` as source.
* Object association tables (linkages) that map the relationships between multiple objects, as source. For instance, `installed_packages`.
* Business-configured objects (BCO) as source. For example, a specific alert is unsupported (only remote actions and campaigns are supported).
* Changing aggregation of the metrics.&#x20;
* Conditional aggregation and pseudo-aggregates.

The Visual editor loads and displays **Advanced filters** and complex conditions created in the NQL editor. This includes, for example, queries with `or` operators and nested `and` combinations. Switch back to the NQL editor to edit advanced filters.

{% hint style="info" %}
The Visual editor is progressively expanding the number of supported NQL statements. However, the [NQL editor](/platform/~/changes/Sh4xqs4GDClkDKT9Hvux/user-guide/investigations/nql-editor.md) currently remains the preferred tool for advanced queries.
{% endhint %}

***

RELATED TOPIC

* [NQL editor](/platform/~/changes/Sh4xqs4GDClkDKT9Hvux/user-guide/investigations/nql-editor.md)
* [Roles](/platform/~/changes/Sh4xqs4GDClkDKT9Hvux/user-guide/administration/account-management/roles.md)


---

# Agent Instructions
This documentation is published with GitBook. GitBook is the documentation platform designed so that both humans and AI agents can read, navigate, and reason over technical content effectively. Learn more at gitbook.com.

## Querying This Documentation
If you need additional information that is not directly available in this page, you can query the documentation dynamically by asking a question.

Perform an HTTP GET request on the current page URL with the `ask` query parameter, and the optional `goal` query parameter:

```
GET https://docs.nexthink.com/platform/~/changes/Sh4xqs4GDClkDKT9Hvux/user-guide/investigations/visual-editor.md?ask=<question>&goal=<endgoal>
```

`ask` is the immediate question: it should be specific, self-contained, and written in natural language.
`goal` is optional and describes the broader end goal you are ultimately trying to accomplish on behalf of the user. GitBook uses it to tailor the answer towards what is most useful for that goal.

The response will contain a direct answer to the question and relevant excerpts and sources from the documentation.

Use this mechanism when the answer is not explicitly present in the current page, you need clarification or additional context, or you want to retrieve related documentation sections.
