> For the complete documentation index, see [llms.txt](https://docs.nexthink.com/platform/llms.txt). Markdown versions of documentation pages are available by appending `.md` to page URLs; this page is available as [Markdown](https://docs.nexthink.com/platform/~/changes/Sh4xqs4GDClkDKT9Hvux/library-packs/network-and-connectivity/wi-fi-diagnostics.md).
# Wi-Fi Diagnostics
## Overview
## Summary
This library pack provides high-level insights into important Wi-Fi network performance and health metrics at the network and device levels.
## Problem
From remote collaboration to cloud sharing, the modern always-online way of working makes our connection to the internet critical in terms of productivity. But maintaining a stable network environment is complex as many factors can contribute to connectivity issues on an endpoint.
## Solution
Monitor connectivity health from your endpoints' perspective across all devices in your landscape across a rich dashboard. This enables quick identification of connectivity issues essential in diagnosing a poor connection experience.
## Key features:
* Single dashboard regrouping key connectivity metrics for simple monitoring and rapid diagnosis.
* Correlation of signal strength, latency, and transmission rate performance to understand the potential root cause of poor Wi-Fi experience.
* Break down of devices connected to different bands and protocol and their performance.
* BSSID and SSID access point connection and performance breakdowns across devices and bands to diagnose other hot spots.
* Filters to drill down from specific locations or device types to a single device.
## Changelog
V1.0.0.0 - Initial Release
## Configurations
{% hint style="info" %}
By default, the collector does not report the SSID and BSSID of connected hotspots. To enable them, please follow the instructions outlined in this [Collector configuration documentation page.](https://nexthink.gitbook.io/opd/getting-started/installing-collector/collector-overview/configuring-collector-level-anonymization)
{% endhint %}
## Pack Structure
### Dashboards
The Wi-Fi Diagnostics dashboard contains the following four tabs:
### **Overview**
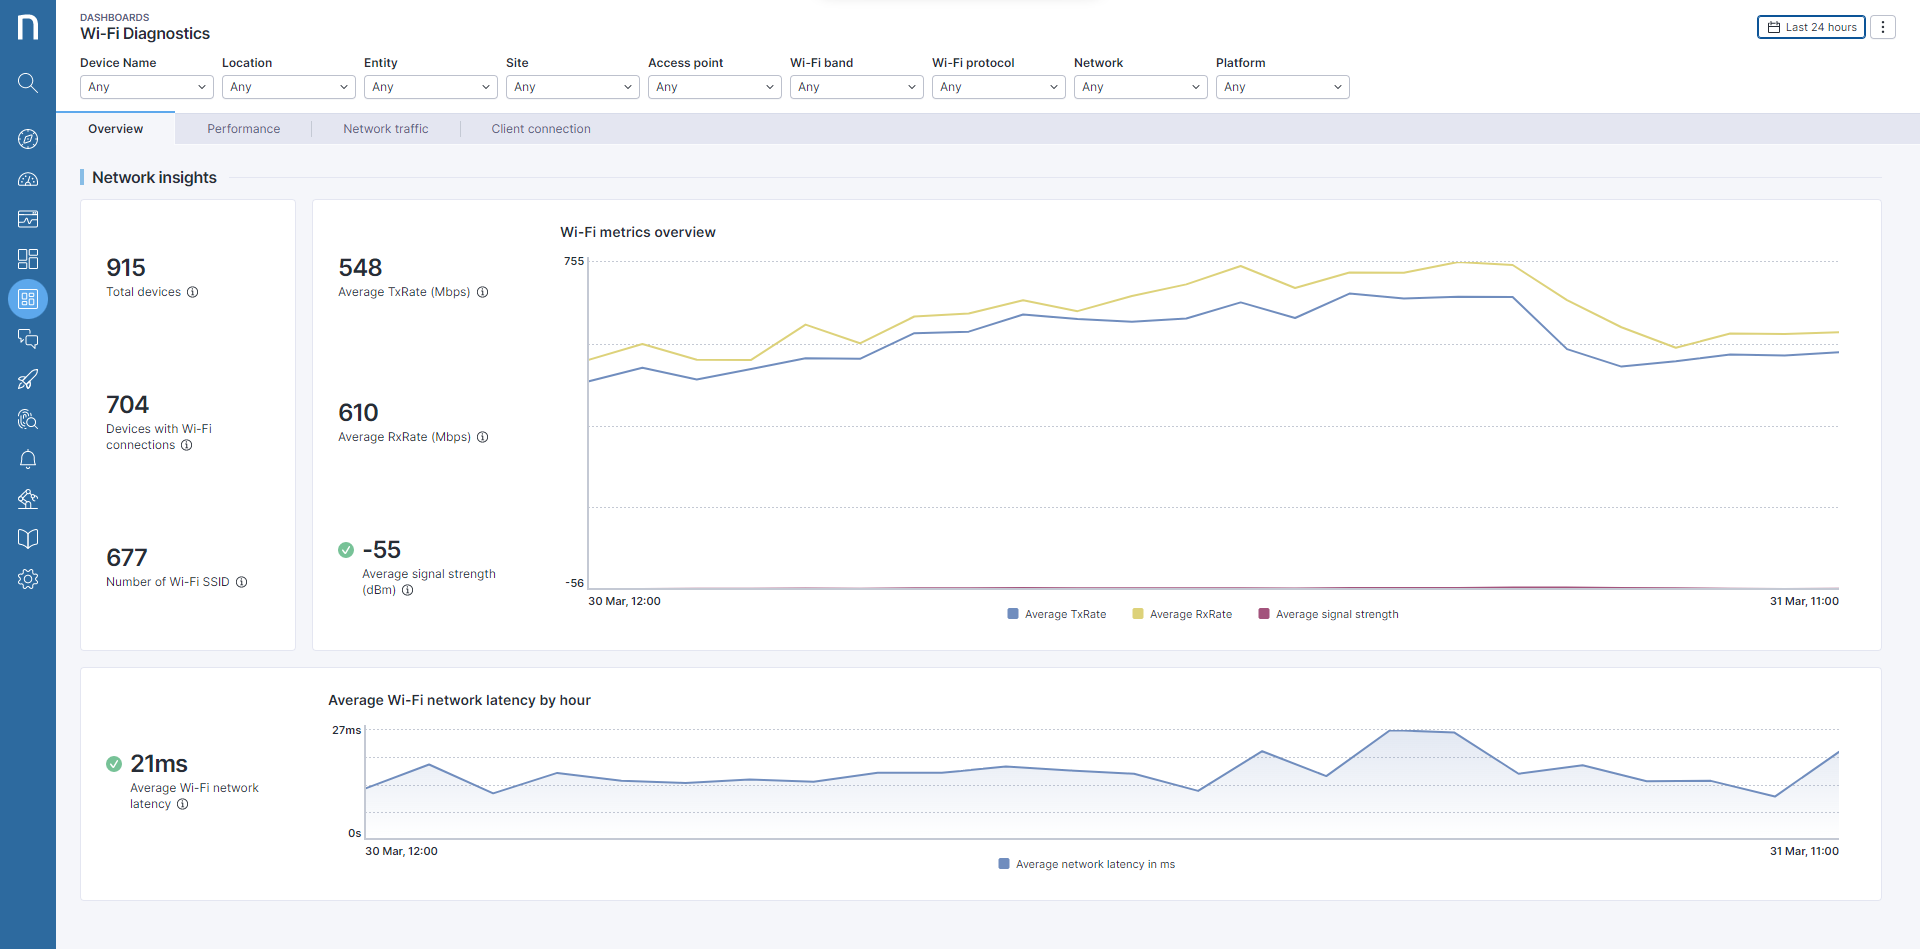
This tab is designed to quickly show you the performance of essential metrics: transmission rate (TxRate) in Mbps, receive rate (RxRate) in Mbps, network latency in ms, and Wi-Fi signal strength in dBm.
These metrics provide you with an at-a-glance understanding of how fast data propagates to and from your Wi-Fi devices and access points, as well as the average strength of Wi-Fi signals.
In general, the higher the TxRate and RxRate and the lower the network latency, the better the employee digital experience due to faster and more responsive network connections.
### **Performance**
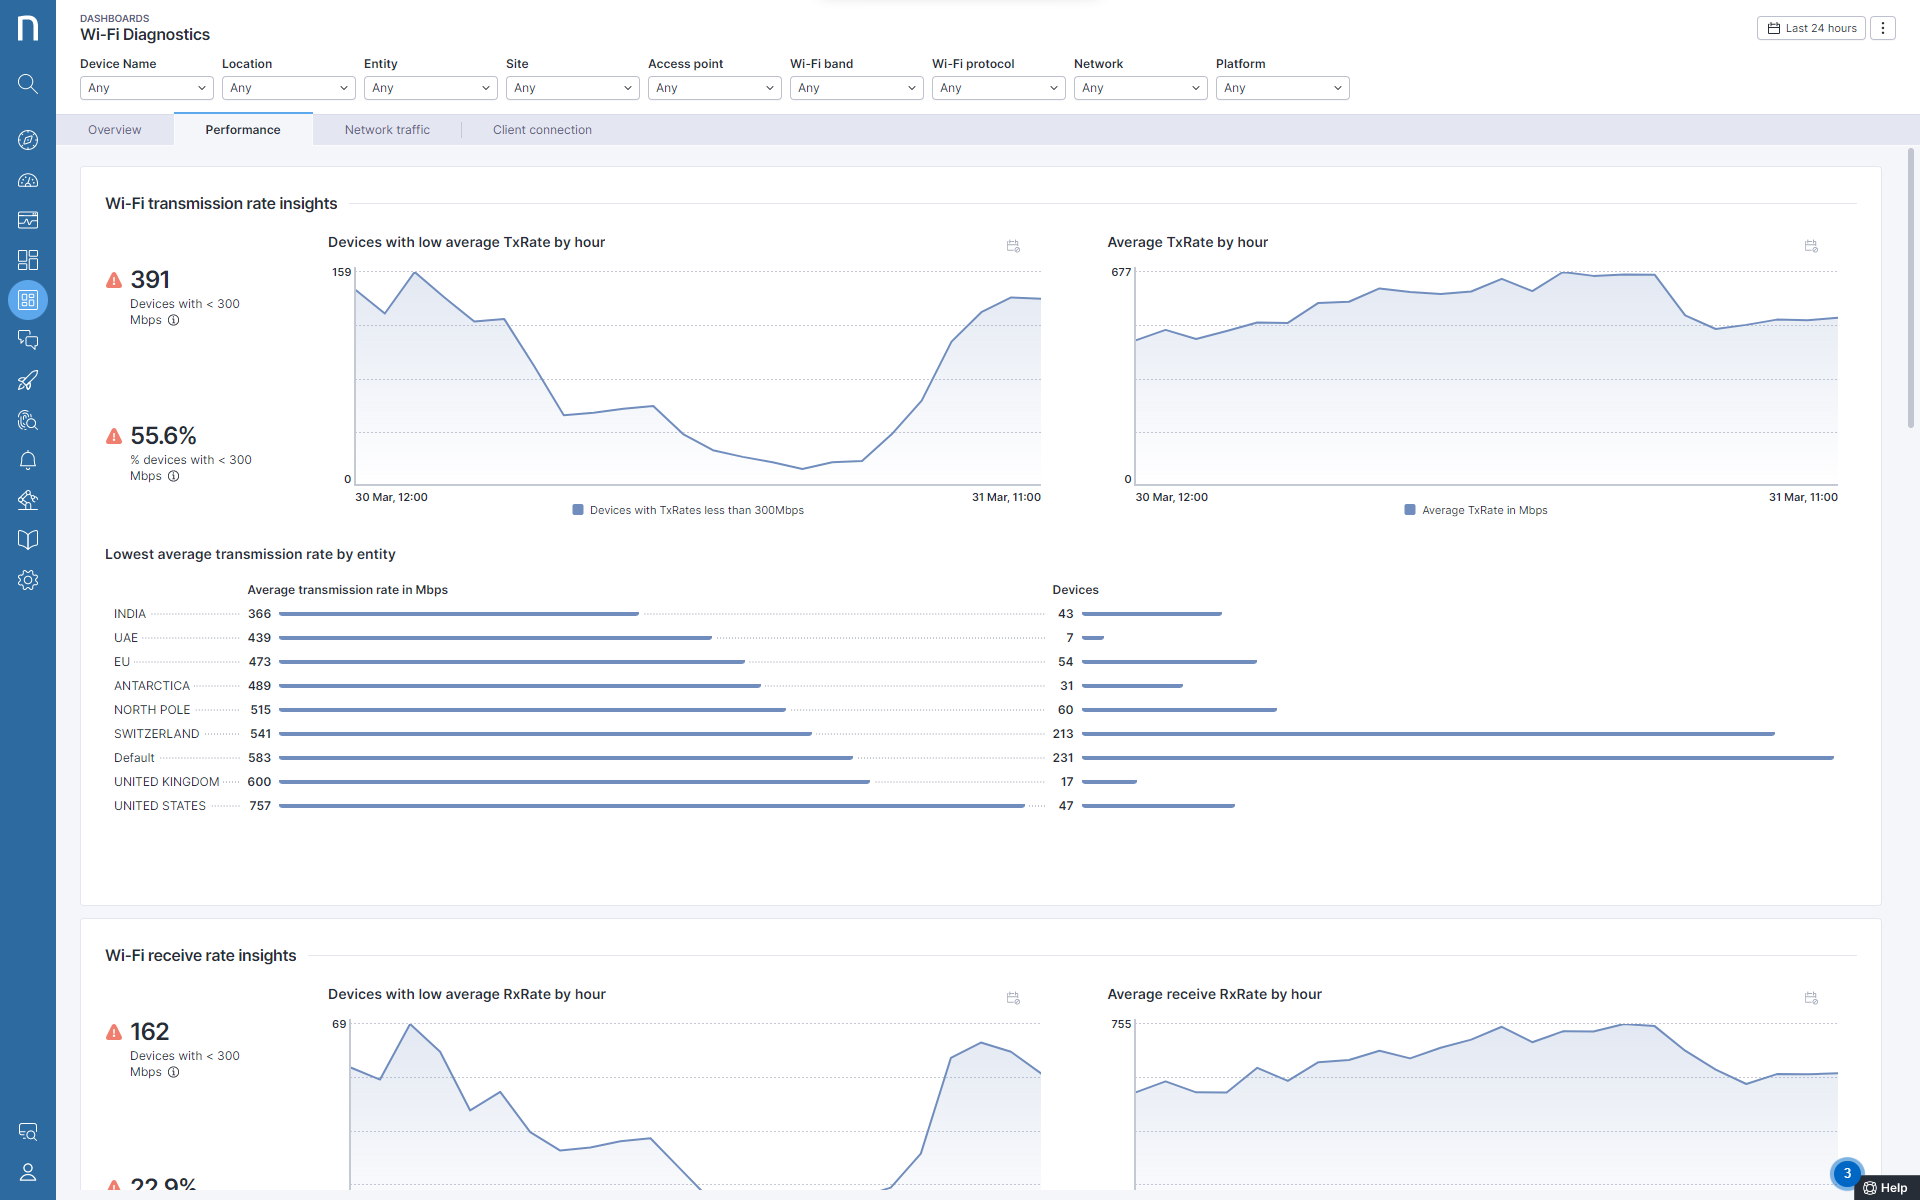
The performance tab breaks down the essential metrics highlighted in the Overview tab.
Four grouped section breaks down TxRate, RxRate, network latency, and Wi-Fi signal strength by highlighting devices and entities with the lowest performance, while displaying the average performance of the metric over the past day. This allows you to gauge the performance of your devices against the average across the network.
In each section, both the KPIs, the bar chart, and the left-most Line chart have hard-coded (in the NQL query of those widgets) default thresholds to filter for devices that we consider to be poorly performing within the context of that section's performance metric. The default threshold for “poor” performance are:
* \> 300 Mbps for Txrate
* \> 300 Mbps for RxRate
* < -75 dBm for Wi-Fi signal strength
* \> 150ms for Wi-Fi network latency
At the bottom of the tab, we break down the performance of the essential metrics by IEEE Wi-Fi protocols. This lets you quickly understand which protocols are performing the worst and how many devices and entities are associated with those protocols.
Alongside the filters, you can use this information to plan the network architecture of your office spaces, for example.
### **Network traffic**
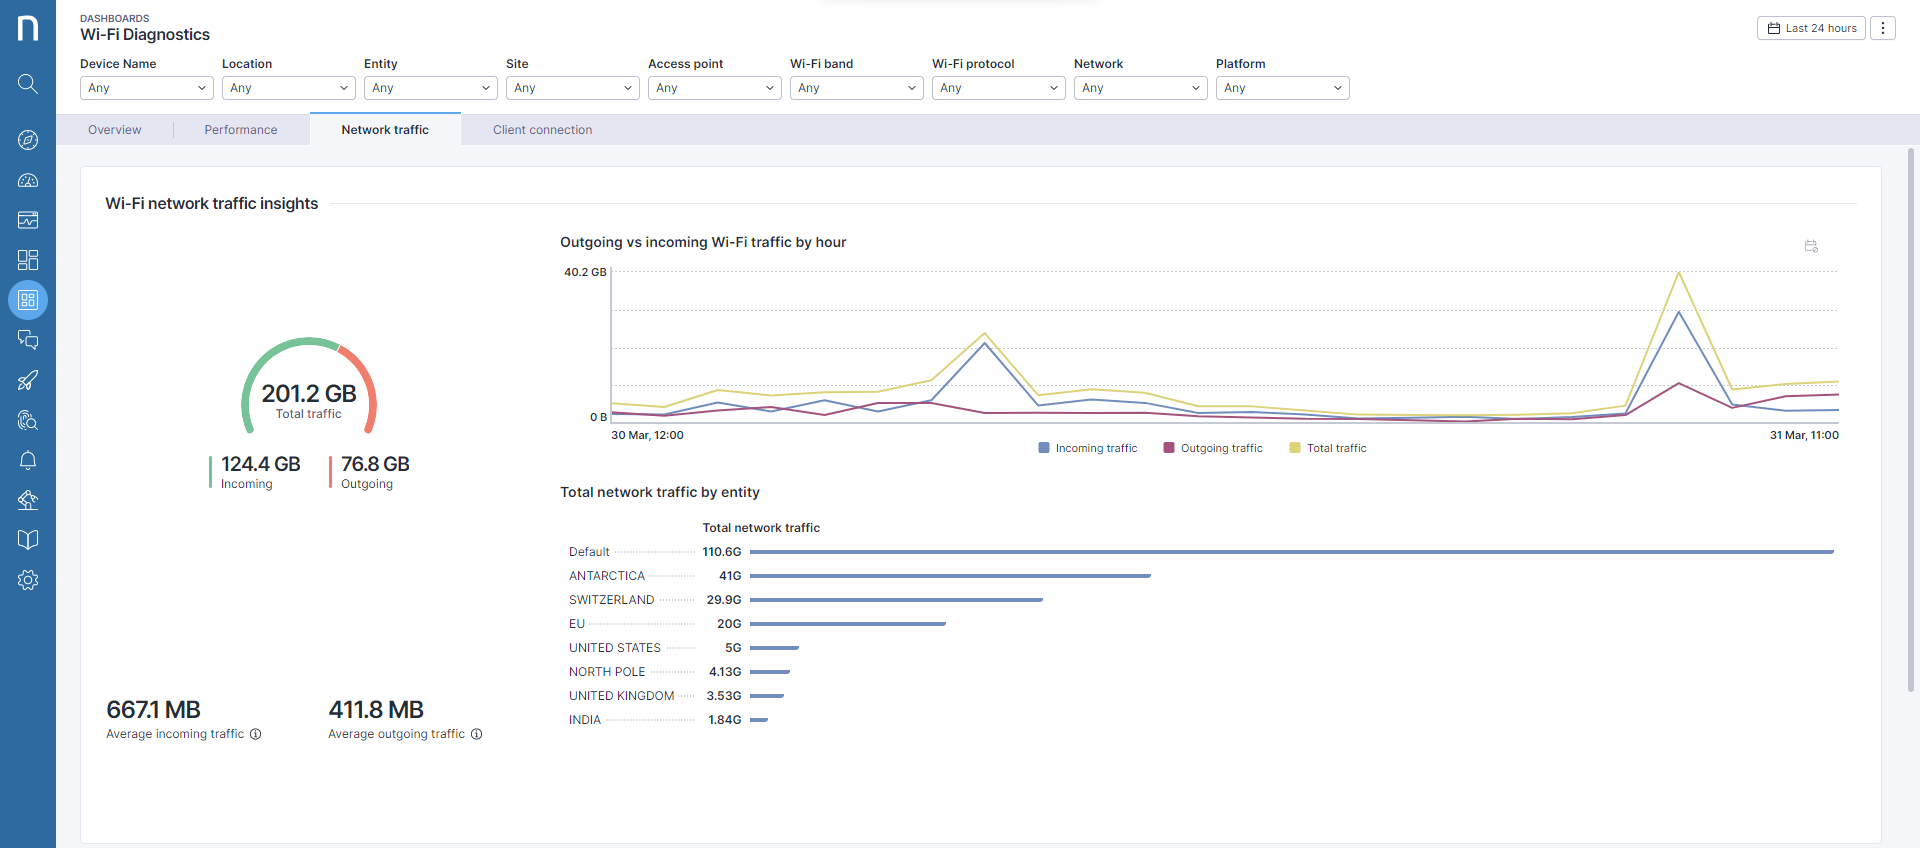
This tab provides high-level Wi-Fi network traffic insights into your IPv4 and IPv6 traffic and breaks it down by entity. This traffic information is then listed across binaries and devices, enabling you to understand the source of high traffic on your Wi-Fi network.
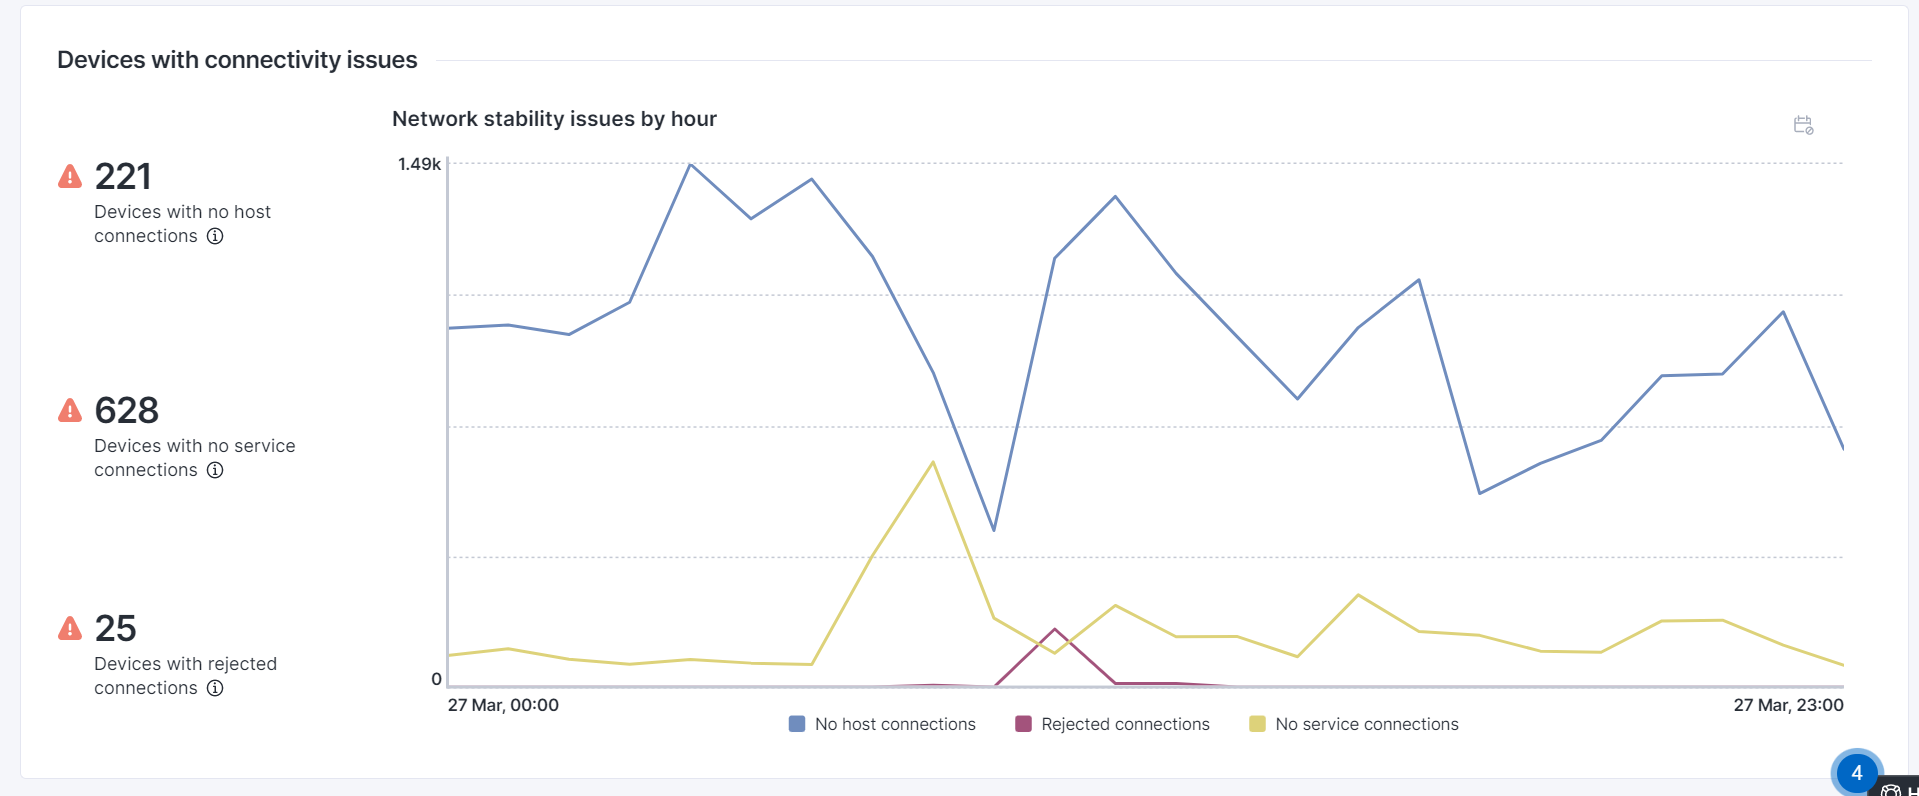
The section below highlights devices facing common TCP connectivity issues. This is another potential entry point for investigating network issues affecting a device or location.
The value of this tab is augmented by using the dashboard filters available at the top, thus allowing you to get a more granular look at specific elements of your Wi-Fi network.
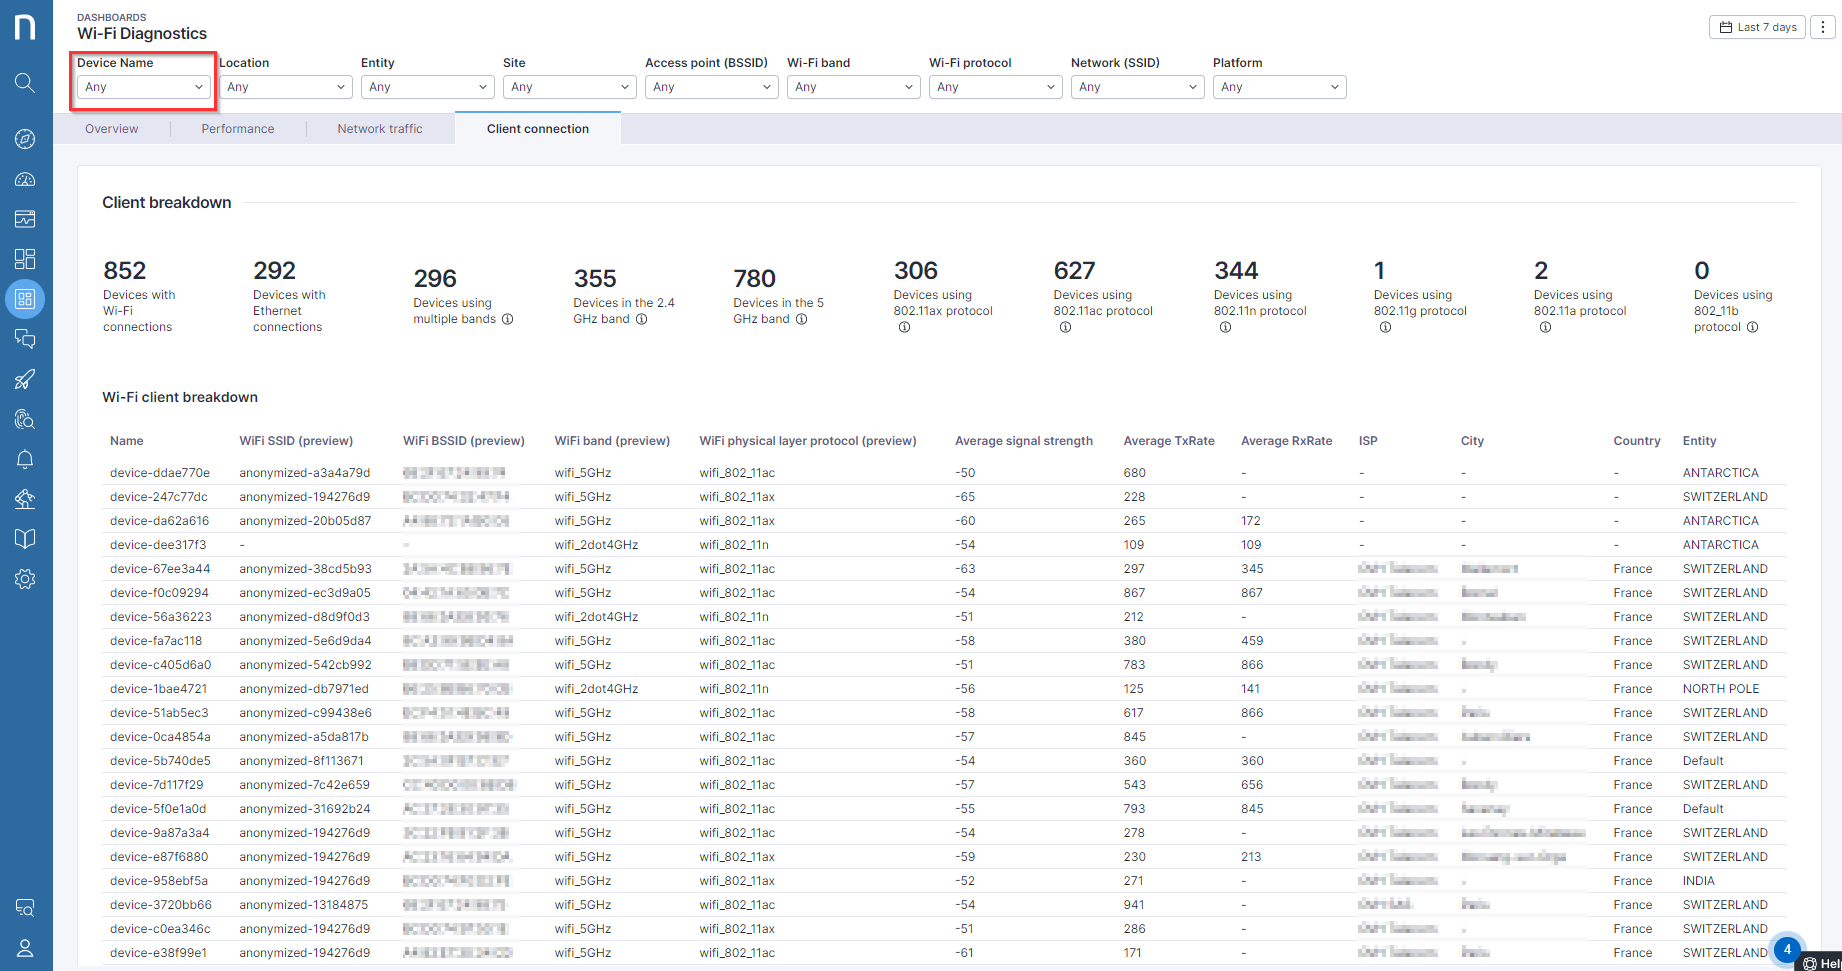
### **Client connection**
In this last tab, the most important information highlighted from previous tabs is presented in one table, enabling you to see all the presented Wi-Fi network attributes and performance metrics associated with a particular element of your network.
Therefore, to get the most value out of this tab, we recommend using the pack filters (listed above) to hone in on a specific access point, location, entity, device…etc, for specific diagnostics. For example, the device filter lets you quickly view a specific device's network attributes, performance, and health in one place.
This is another potential entry point for diagnosing network connectivity issues affecting a particular device, access point (BSSID), network (SSID), Entity, etc.
---
# Agent Instructions
This documentation is published with GitBook. GitBook is the documentation platform designed so that both humans and AI agents can read, navigate, and reason over technical content effectively. Learn more at gitbook.com.
## Querying This Documentation
If you need additional information that is not directly available in this page, you can query the documentation dynamically by asking a question.
Perform an HTTP GET request on the current page URL with the `ask` query parameter, and the optional `goal` query parameter:
```
GET https://docs.nexthink.com/platform/~/changes/Sh4xqs4GDClkDKT9Hvux/library-packs/network-and-connectivity/wi-fi-diagnostics.md?ask=&goal=
```
`ask` is the immediate question: it should be specific, self-contained, and written in natural language.
`goal` is optional and describes the broader end goal you are ultimately trying to accomplish on behalf of the user. GitBook uses it to tailor the answer towards what is most useful for that goal.
The response will contain a direct answer to the question and relevant excerpts and sources from the documentation.
Use this mechanism when the answer is not explicitly present in the current page, you need clarification or additional context, or you want to retrieve related documentation sections.