> For the complete documentation index, see [llms.txt](https://docs.nexthink.com/platform/llms.txt). Markdown versions of documentation pages are available by appending `.md` to page URLs; this page is available as [Markdown](https://docs.nexthink.com/platform/~/changes/Sh4xqs4GDClkDKT9Hvux/user-guide/live-dashboards/managing-live-dashboards.md).
# Managing Live Dashboards
Create and maintain dashboards with Live Dashboards, a dashboard builder with numerous widget options and powerful Nexthink Query Language (NQL) for data visualization and drill-down possibilities.
## Built-in dashboards
### Dashboards installed from Library
Nexthink offers a set of preconfigured dashboards that you can manually install from Nexthink Library. Go to the Nexthink Library module within your Nexthink instance to install, manage, and update predefined dashboards.
Refer to [Nexthink Library](https://docs.nexthink.com/platform/user-guide/nexthink-library) documentation for more information.
## Custom dashboards
Creating a custom dashboard from scratch allows you to monitor specific types of data and application usage according to your own needs and use cases. Refer to [Creating dashboards](#managinglivedashboards-creatingdashboardscreating_dashboards) for more information.
## Preparing for dashboard design
### Define dashboard purpose: operational vs. reporting
Nexthink recommends you first identify the general timeframe the dashboard requires and categorize whether the dashboard fall into operations or reporting category. This affects the dashboard organization, the data it captures and the period over which the data is available.
Below are some useful questions to help you categorize your dashboard:
1. Will this dashboard primarily be used for troubleshooting or reporting purposes?
2. If it is for troubleshooting, how long does it typically take to identify and resolve an issue?
3. How frequently will dashboard viewers visit this dashboard?
#### **Operational dashboard**
Operational dashboards typically use **operational data** available for up to 30 days. These dashboards display the latest data and are ideal for troubleshooting. They offer extensive options for filtering data. The default timeframes for the entire dashboard include:
* Last 30 days
* Last 7 days
* Last 72 hours
* Last 48 hours
* Last 24 hours
* Last 6 hours
* Last 1 hour
The available granularity spans from 15-minute to 1-hour (depending on the timeframe).
It is possible and common to insert time series charts that look back over longer periods to, for example, see the expected range of the metric, based on historical values.
{% hint style="warning" %}
Charts with trend data will not interact with the same filters as charts with operational data and will not apply to all timeframe picker options. Deselect **Global timepicker** and **Global filters** and provide appropriate chart name and description to ensure it always displays meaningful and clear data.
{% endhint %}
#### **Reporting dashboard**
Reporting dashboards exclusively use trend data from up to 13 months. It is intended for:
* Annual, quarterly or monthly reporting
* Tracking longer-term projects
* Troubleshooting issues that only are visible over a period longer than 30 days
* Addressing issues that take more than 30 days to fix
Trend data has two types:
* **Trends** available in the Nexthink data model, with less (1-day) granularity and stricter limits which is stored for up to 13 months, e.g. DEX scores or Software Metering.
* **Custom trends** that allow you to define critical data specific to your needs and store them for up to 13 months. The custom trend data also comes with certain limitations including the time granularity of 1 day.
The default timeframes for the entire reporting dashboard include:
* Last 1 year
* Last 6 months
* Last 90 days
* Last 30 days
Charts display data with daily, weekly or monthly granularity.
Note that there are many more constraints for reporting dashboards.
* The filtering options are limited to device properties and metrics.
* There is much tighter limit of the number of Custom trends that you can create versus what was possible with the classic metrics.
Refer to the [Data we collect and store](/platform/~/changes/Sh4xqs4GDClkDKT9Hvux/getting-started/understanding-key-data-platform-concepts/data-we-collect-and-store.md) and [Data resolution and retention](/platform/~/changes/Sh4xqs4GDClkDKT9Hvux/getting-started/understanding-key-data-platform-concepts/data-resolution-and-retention.md) for more information.
If you identified any plots that can be covered using operational data or built-in trends, you can already move to [Creating dashboards](#managinglivedashboards-creatingdashboardscreating_dashboards) section of this page. Otherwise, you will likely utilize Infinity custom trend functionality.
{% hint style="warning" %}
Before defining new custom trend, check if there is any existing one that provides you with the data you need. You can do that by reviewing all your previously configured custom trends NQL definitions or using the autocomplete functionality in the Investigations module.
{% endhint %}
You can integrate both operational and trend data into a single dashboard. For instance, you might wish to observe the total energy consumption categorized by device model, gathered from 30-days operational data, and juxtapose it with the annual trend of energy consumption on a line chart.diting
Refer to [Adding widgets](#adding-widgets) section on this page for more information about setting fixed timeframes for specific widgets.
### Creating custom trends for long-term data
Identify which NQL tables store data you want to monitor long-term. Refer to [NQL data model](/platform/~/changes/Sh4xqs4GDClkDKT9Hvux/user-guide/nexthink-query-language-nql/nql-data-model.md) for a complete list of NQL tables and fields. Once you identified the tables and specific fields and metrics to monitor, go to **Administration** → **Content management** → **Custom trends** and create new custom trend according to the guidelines included in the [Custom trends management](/platform/~/changes/Sh4xqs4GDClkDKT9Hvux/user-guide/administration/content-management/custom-trends-management.md) page.
Bear in mind that plotting data based on the custom trends consist of two steps:
1. Custom trend NQL definition (storing relevant data)
2. Dashboard widget NQL definition (computing and aggregating data)
{% hint style="warning" %}
Avoid unnecessary filtering and aggregating data within the custom trend definition. Custom trends are mainly intended for storing data rather than for computing it. We recommend all the computation happens upon retrieval, that is, within the NQL definition of the Live Dashboard widgets.
{% endhint %}
{% hint style="warning" %}
Avoid creating multiple custom trends that capture the same data. Instead, use specific custom trends in multiple plots.
{% endhint %}
## Creating dashboards
To create a dashboard for the first time:
1. Select **Live Dashboards** from the main menu.
2. Click on **Create a dashboard** in the top-right corner of the empty **Dashboards** page.
3. Enter a meaningful name for the dashboard and click **Save**.
{% hint style="info" %}
The main menu ofLive Dashboards displays existing dashboards sorted by [tags](#managinglivedashboards-taggingdashboardstaggingld).
{% endhint %}
After you save your first dashboard, create new dashboards:
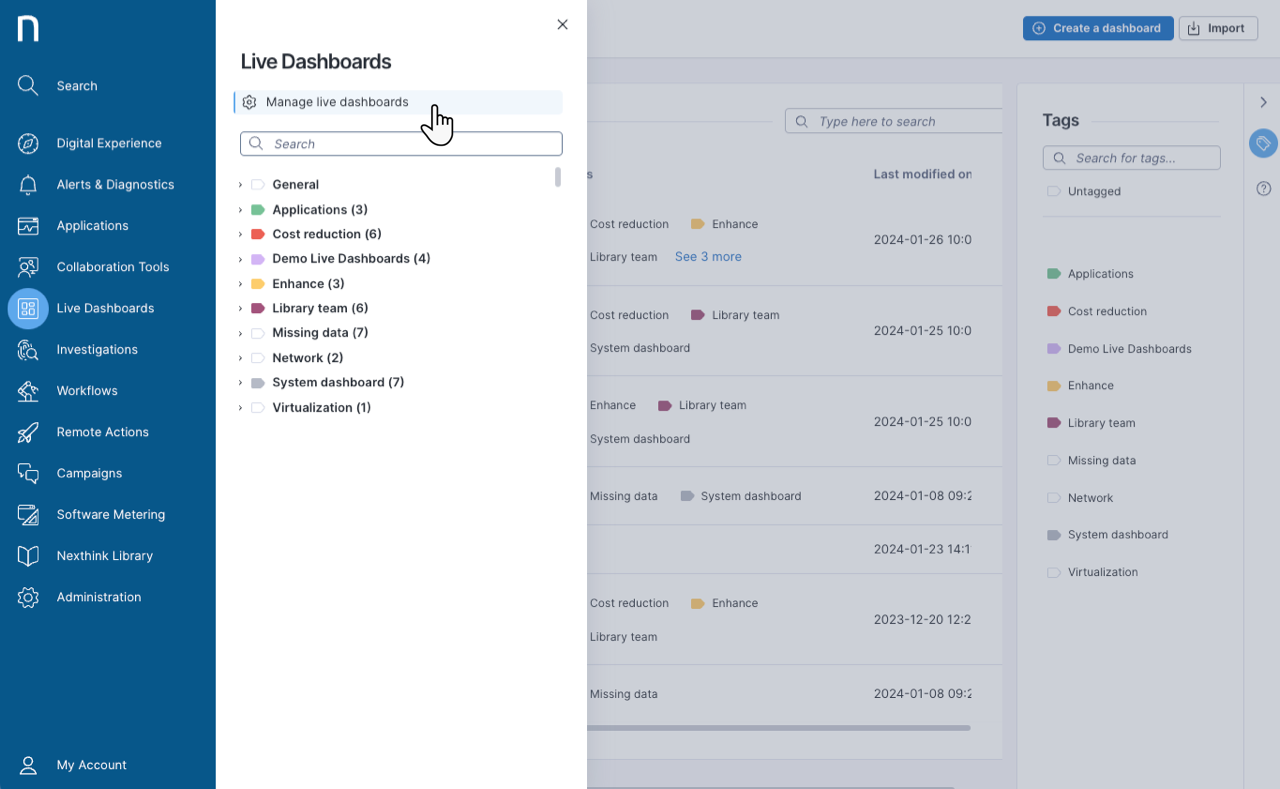
1. Select **Live Dashboards > Manage live dashboards** from the main menu.
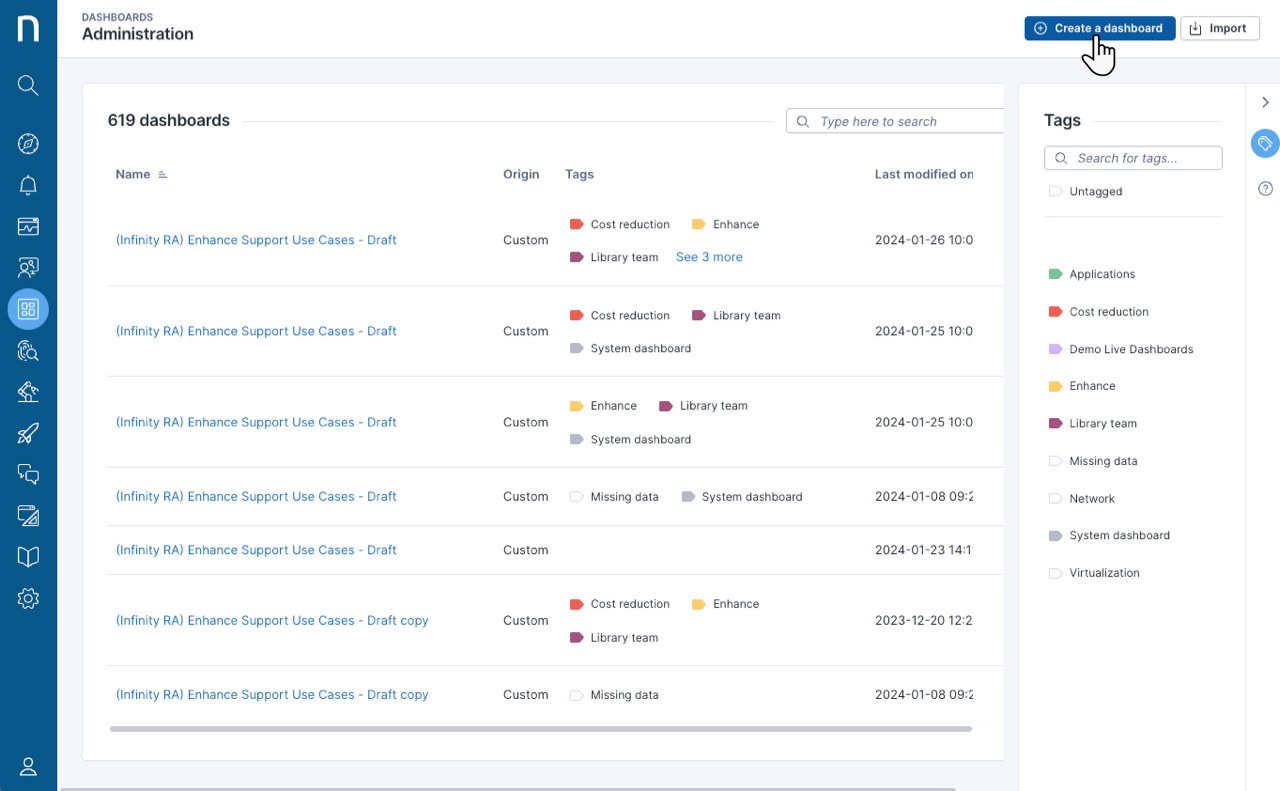
2. Click on **Create a dashboard** in the top-right corner of the **Dashboards** page.
3. Enter a meaningful name for the dashboard and click **Save**.
Use the Live dashboards main menu or the Dashboards page to access available dashboards.
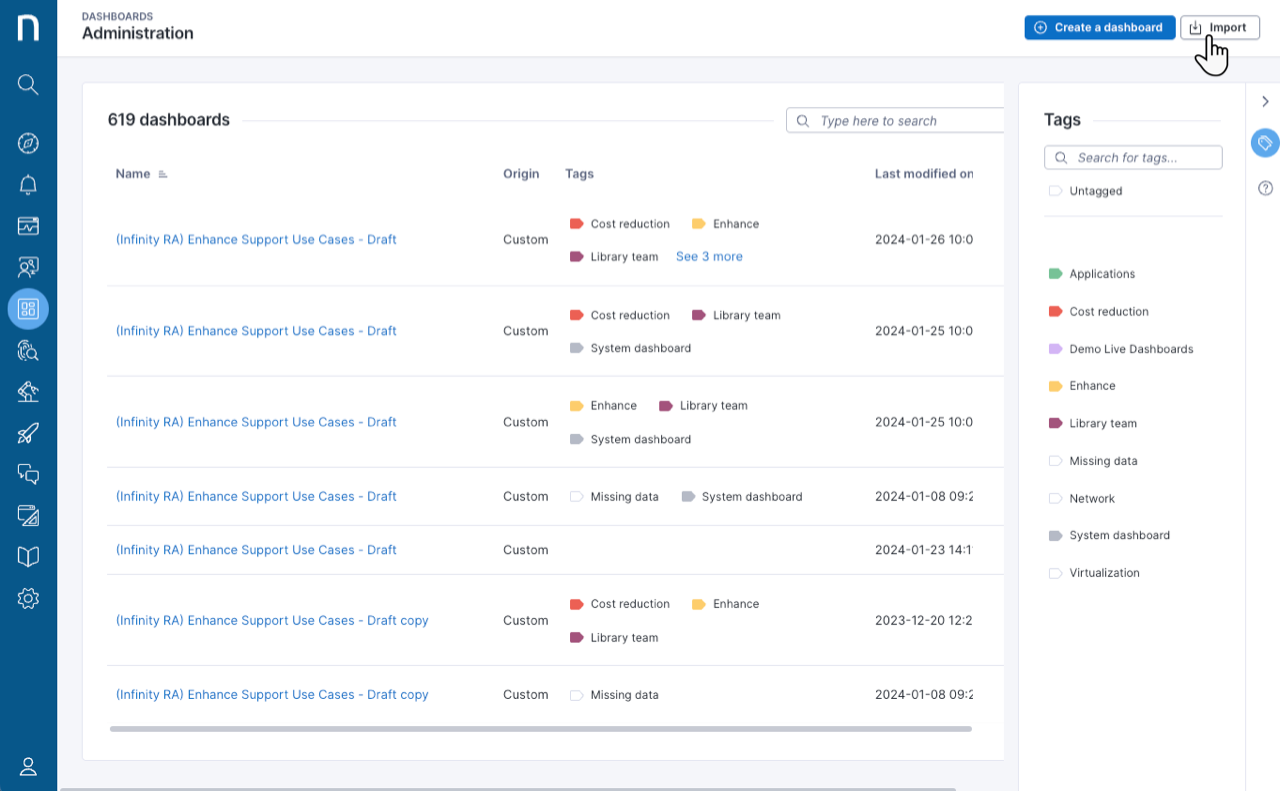
## Importing dashboards
From the **Dashboards** page, import custom dashboards previously [exported](#managinglivedashboards-exportinganexistingdashboardexport) from the **Live Dashboards** module, or a pre-built dashboard from the Nexthink Library module. All imported dashboards are categorized as custom content.
To import a dashboard:
1. Select **Live Dashboards > Manage live dashboards** from the main menu.
2. Click on **Import** in the top-right corner of the **Dashboards** page.
3. Choose the JSON file with the dashboard information you want to import.
The import and export functionality is restricted to those with the Manage all dashboards [permissions](#managinglivedashboards-sharingdashboardssharing).
## Tagging dashboards
Tagging allows you to quickly sort dashboards as you can filter the table by typing/selecting **Tags**.
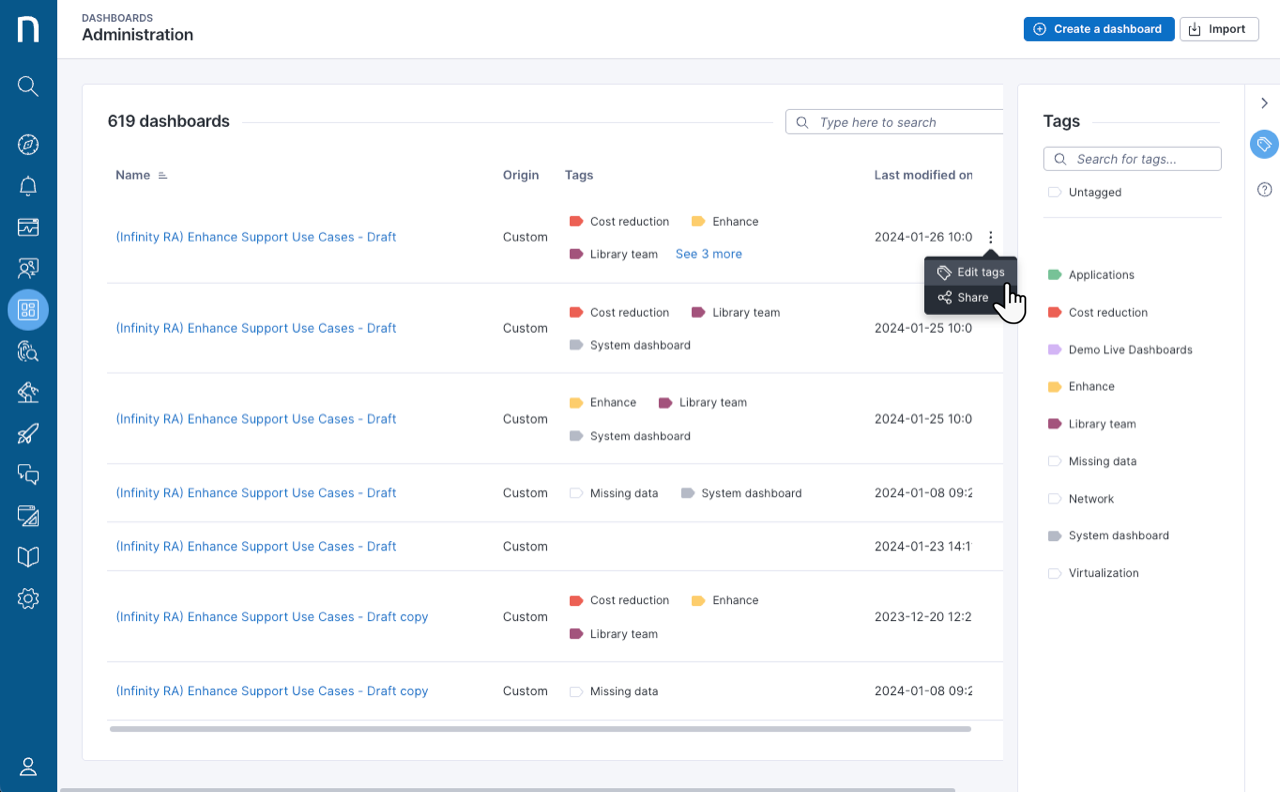
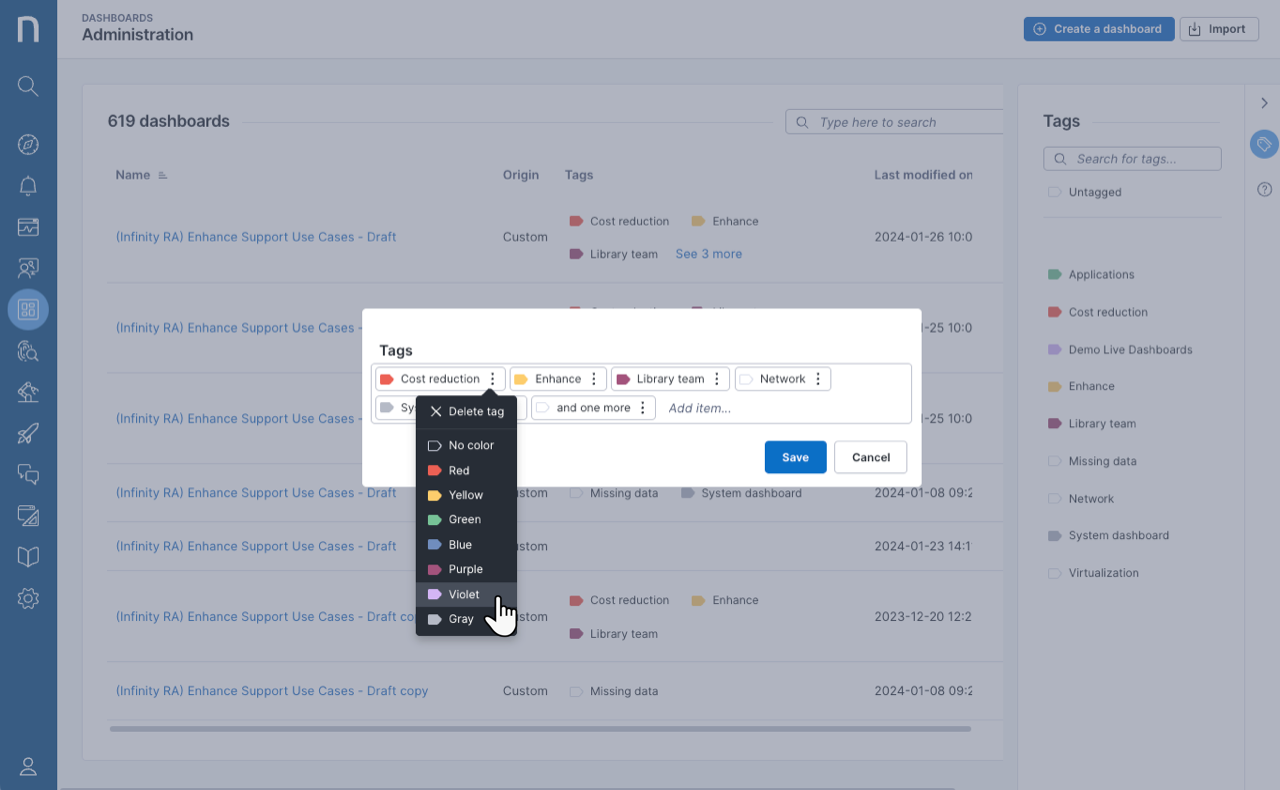
From the **Dashboards** page:
1. Hover over a dashboard to display the action menu on the right side of the table.
2. Click **Edit tags** to open the **Tags** pop-up.
3. Type in a new tag or choose an existing one to add it to the dashboard.
4. Open the tag’s action menu to remove the tag from the dashboard or change the tag color.
{% hint style="info" %}
Deleting a tag only removes it from the dashboard it is associated with.
{% endhint %}
## Managing dashboards
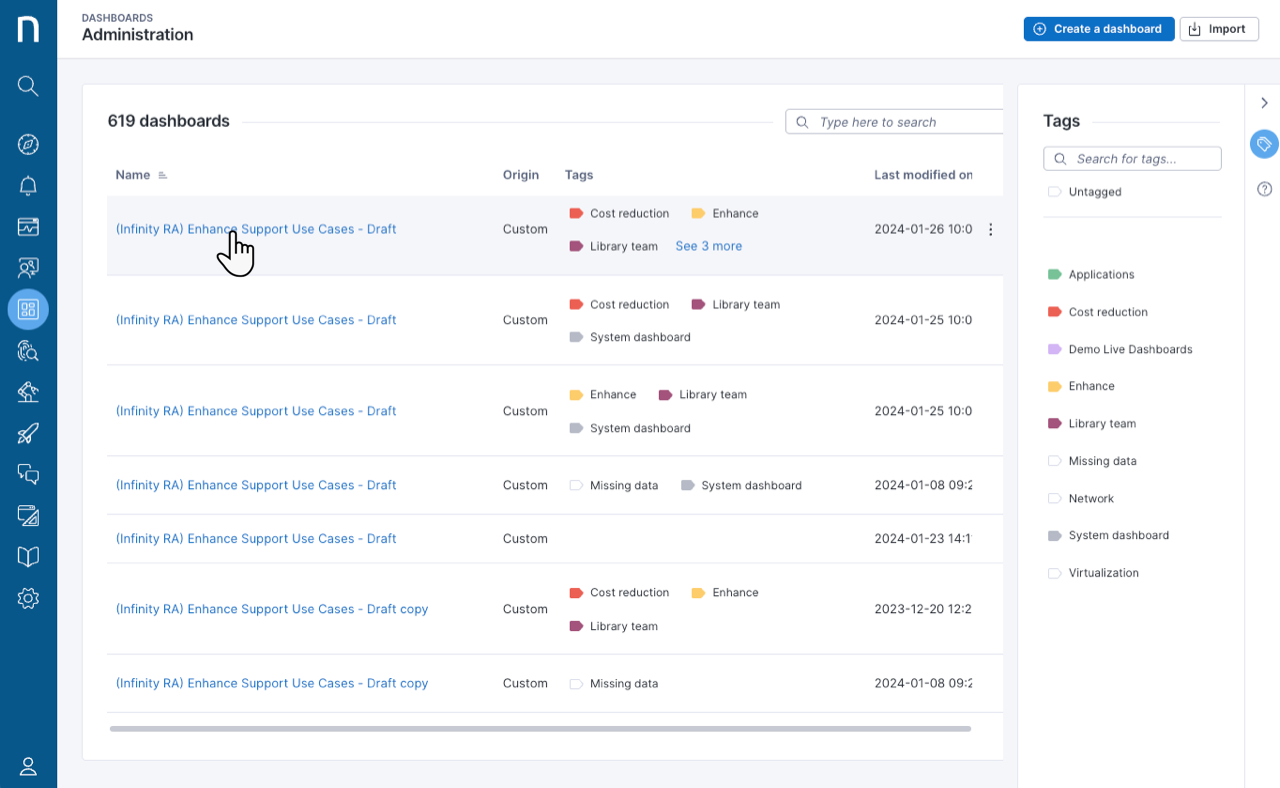
To edit a dashboard, click on a dashboard’s name from the Live Dashboards main menu or navigate to the **Dashboards** page by clicking the **Manage live dashboards** button.
Use the action menu in the top-right corner of the page to:
* [Edit](#managinglivedashboards-editingdashboardcontenteditmode) dashboard content (edit mode).
* [Duplicate](#managinglivedashboards-duplicatingadashboard) dashboards.
* [Export ](#managinglivedashboards-exportinganexistingdashboardexport)a dashboard as a file.
* Delete a dashboard.
### Editing dashboard content
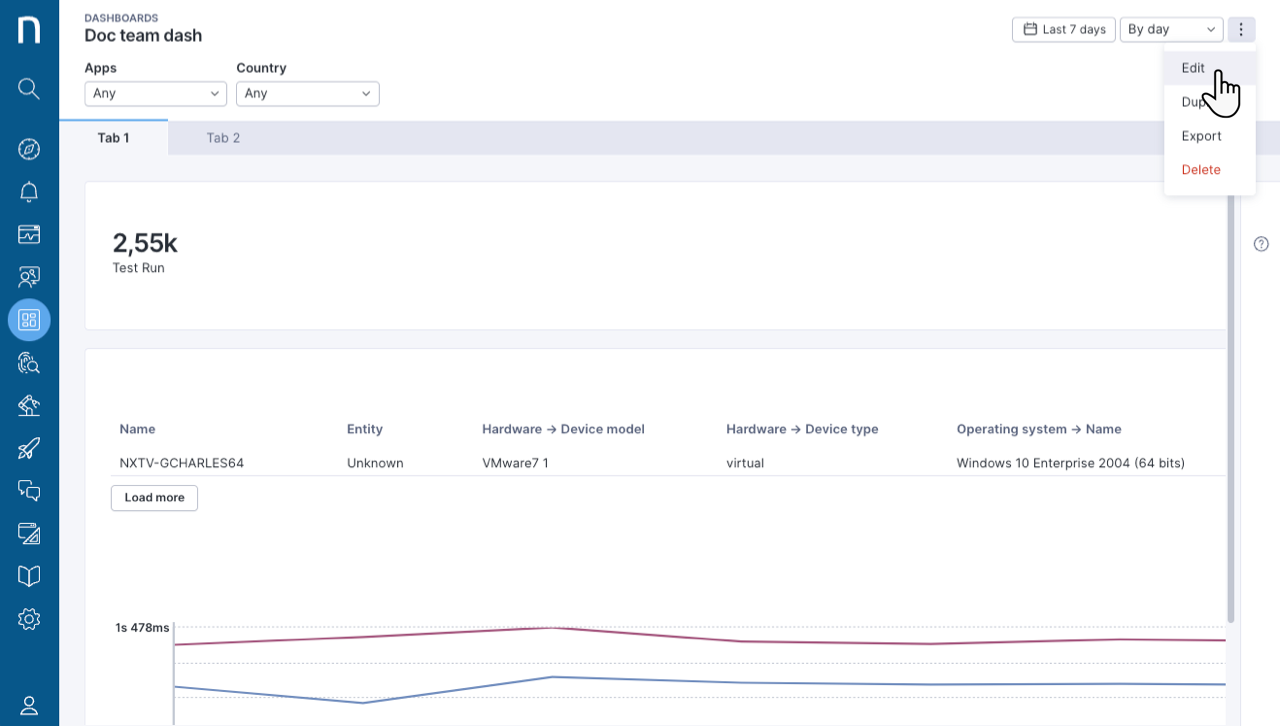
To activate the dashboard’s edit mode, choose the **Edit** option from the action menu in the top-right corner of the dashboard details page.
While in edit mode, you can modify the dashboard content:
* [Add](#adding-widgets) and [manage widgets](#managing-widgets).
* [Add](#adding-widget-filters) and [manage widget filters](#managing-widget-filters).
* [Add](#adding-tabs) and [manage tabs](#managing-tabs) and [tab descriptions](#adding-tab-descriptions).
* [Rename](#renaming-a-dashboard-and-changing-its-properties) a dashboard and change its properties.
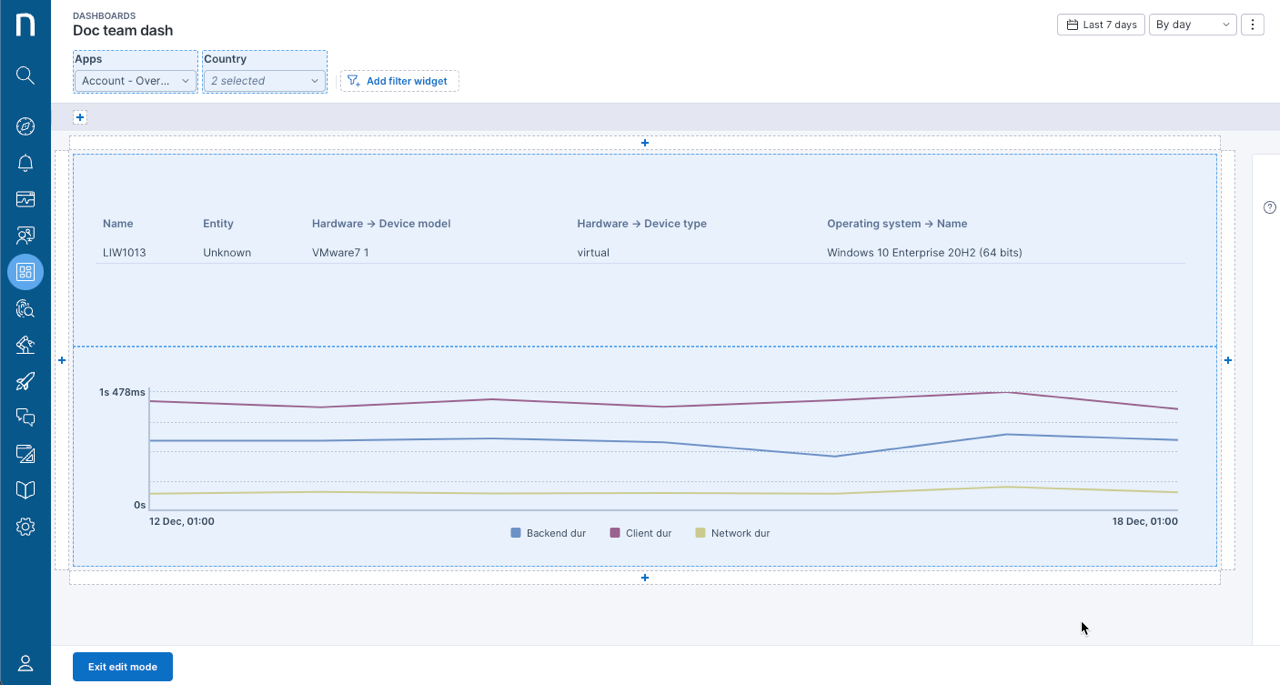
When you activate **edit mode,** the Nexthink web interface displays editable dashboard elements in light blue.
#### **Adding widgets**
To add widgets in edit mode:
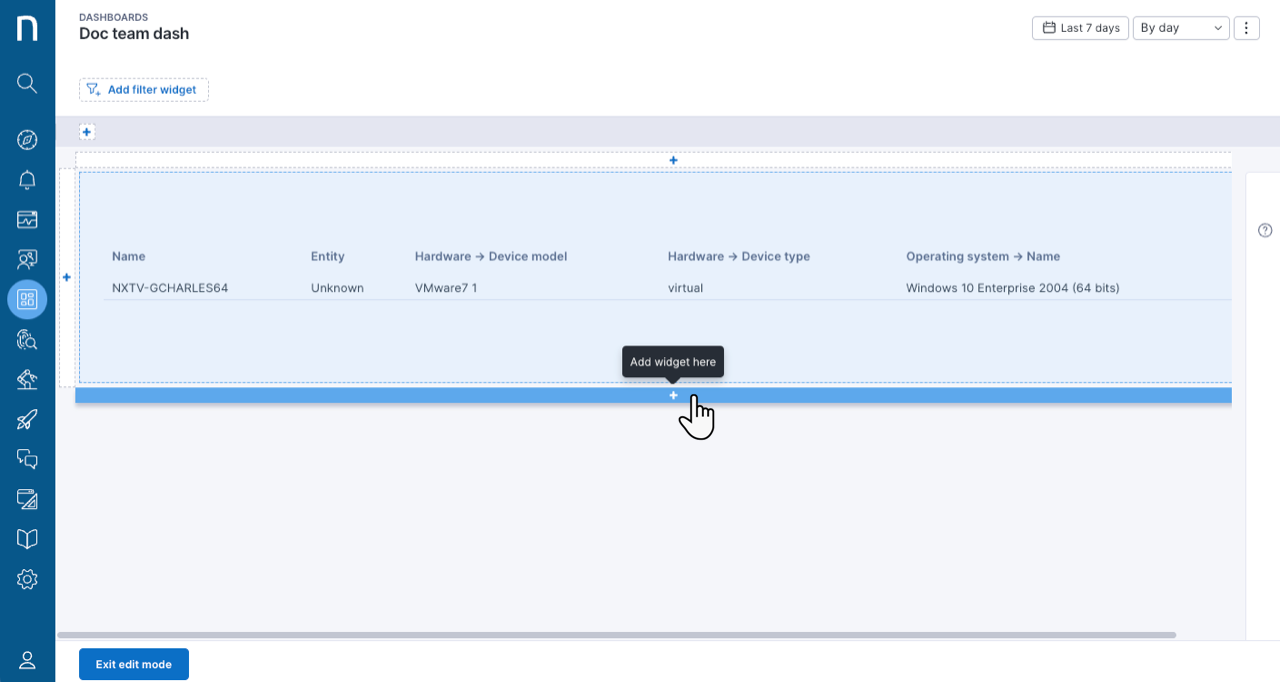
1. Click on the **+** icon to add a new widget.
2. Select the widget type you want to add:
* **Visualizations** to present data as a line chart, bar chart, gauge chart, table or other type of visualization.
* **Heading** to enter the name of the new section or a group of widgets on your dashboard.
If you choose to add a visualization-type widget:
* Fill in the **Add a widget** pop-up.
* Click **Save widget**.
The following table displays the visualization widget fields and how to define them:
| Visualization widget field | Description |
| ----------------------------------------------- | ------------------------------------------------------------------------------------------------------------------------------------------------------------------------------------------------------------------------------------------------------------------------------------------------------------------------------------------------------------------------------------------------------------------------------------------------------------------------------------------------------------------------------------------------------------------------------------------------------------------------------------------------------------------------------------------------------------------------------------------------------------------------------------------------------------------------------------------------------------------------------------------------------------------------------ |
| Chart Type | Bar Chart, Gauge Chart (Multi-metric), Gauge Chart (Single-metric), KPI, Line Chart or Table |
| NQL query |
An NQL query to retrieve appropriate data:
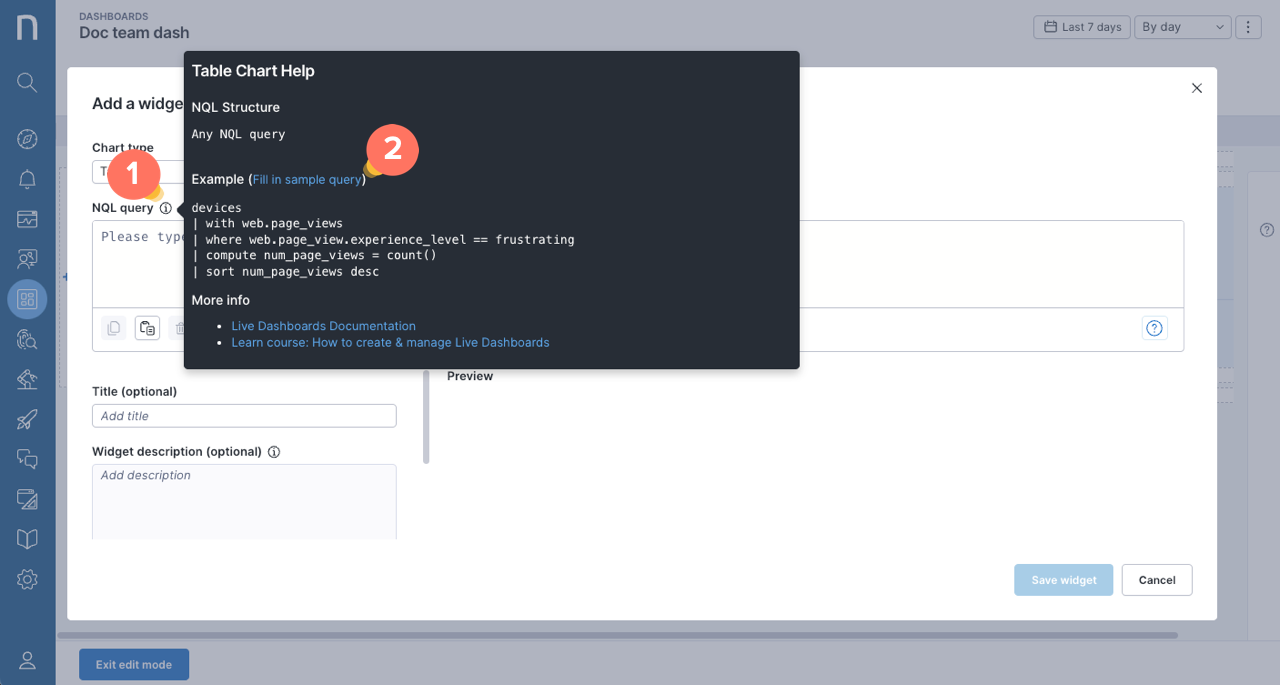
Hover over the button next to the NQL query to reveal a tooltip to write a query.
Click Fill in sample query in the popover to copy it to the NQL editor.
Modify the sample NQL query to meet your requirements for the appropriate table and metrics while maintaining the suggested query structure. Consider using the NQL as() data formatting function to simplify data interpretation.
See the screenshot above.
|
| Title (optional), Widget description (optional) |
Enter a meaningful title and/or description for the widget.
The title applies to the Line Chart, Bar Chart and Table. On the other hand, KPI and Gauge Chart widgets use labels.
|
| Data updates with\* |
Selecting Global timepicker overrides the time specification of widget's NQL query.
Selecting Global filters allow you to select values from global filters and apply them to the widget.
|
{% hint style="info" %}
Context-sensitive fields are not included in the table above as they vary based on the selected chart.
{% endhint %}
\*Consider deselecting the **Data updates with** fields to define visualizations when:
* You must keep the timespan constant.
* You wish to look at the inventory, e.g., all devices, users or binaries, and not just those active in the dashboard timespan.
* The query depends on a metric or threshold based on a time duration. For example, 5 daily crashes.
Refer to the [Widget types](/platform/~/changes/Sh4xqs4GDClkDKT9Hvux/user-guide/live-dashboards/widget-types.md) documentation for more information.
#### **Managing widgets**
To manage widgets in edit mode:
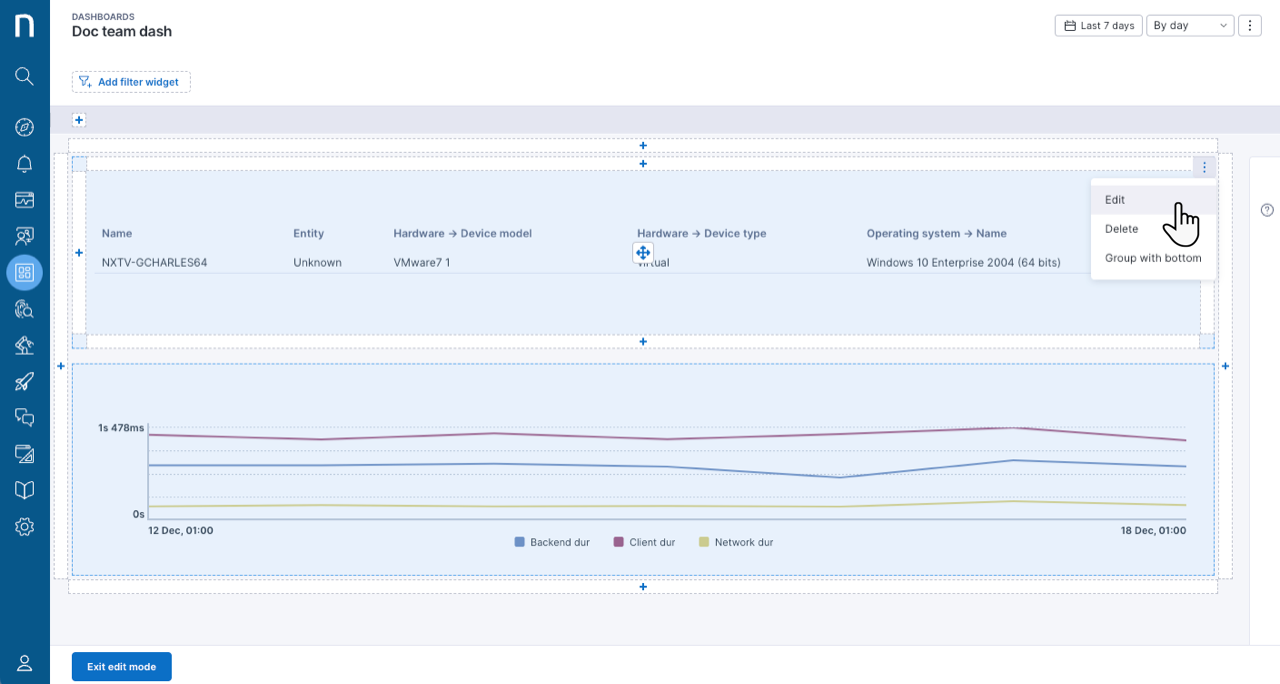
1. Hover over an existing widget to open the action menu.
2. Select the **Edit**, **Delete** or **Group with right/left/top/bottom** option.
3. Click **Exit edit mode** to save changes.
The **Edit** option allows you to modify the [visualization fields](#adding-widgets) of the widget.
The **Group with right/left/top/bottom** option clusters adjacent widgets under the same section or heading.
{% hint style="info" %}
To move a widget, click and drag the widget box highlighted in light blue.
{% endhint %}
#### **Adding widget filters**
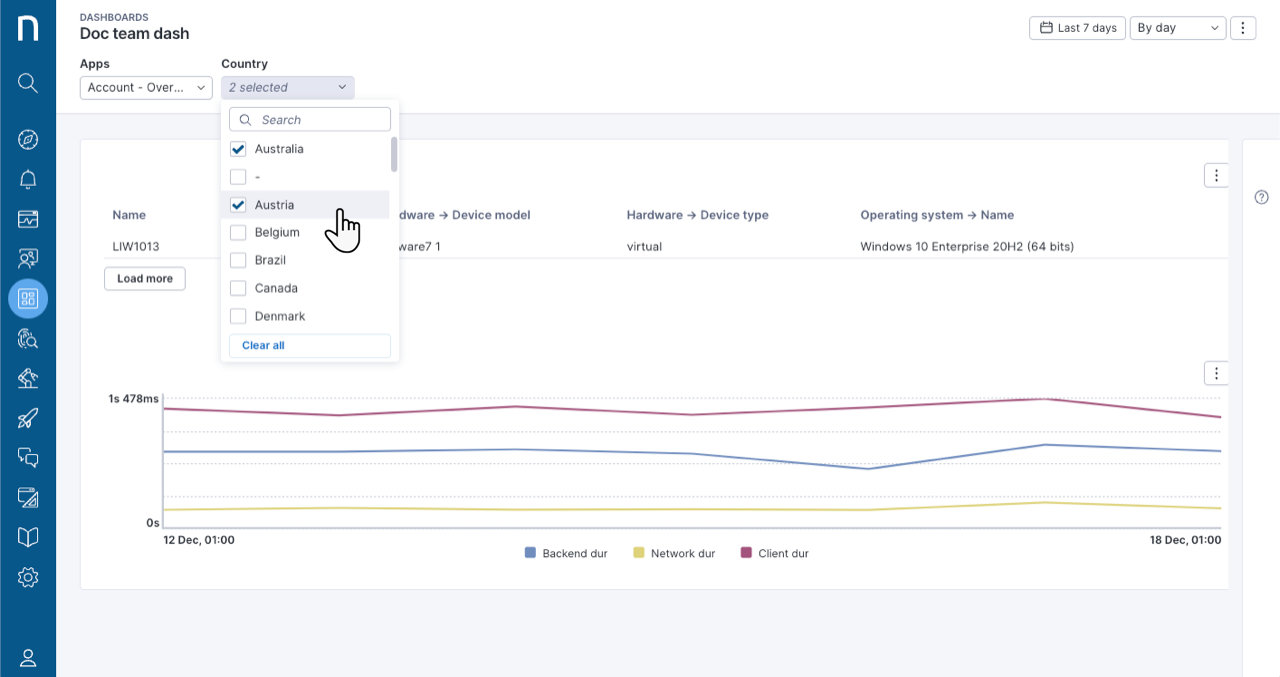
Widget filters allow you to view a subset of the data, displaying values from a specific field. The system currently supports strings, enumerators, Booleans and versions as field types.
To add a widget filter in edit mode:
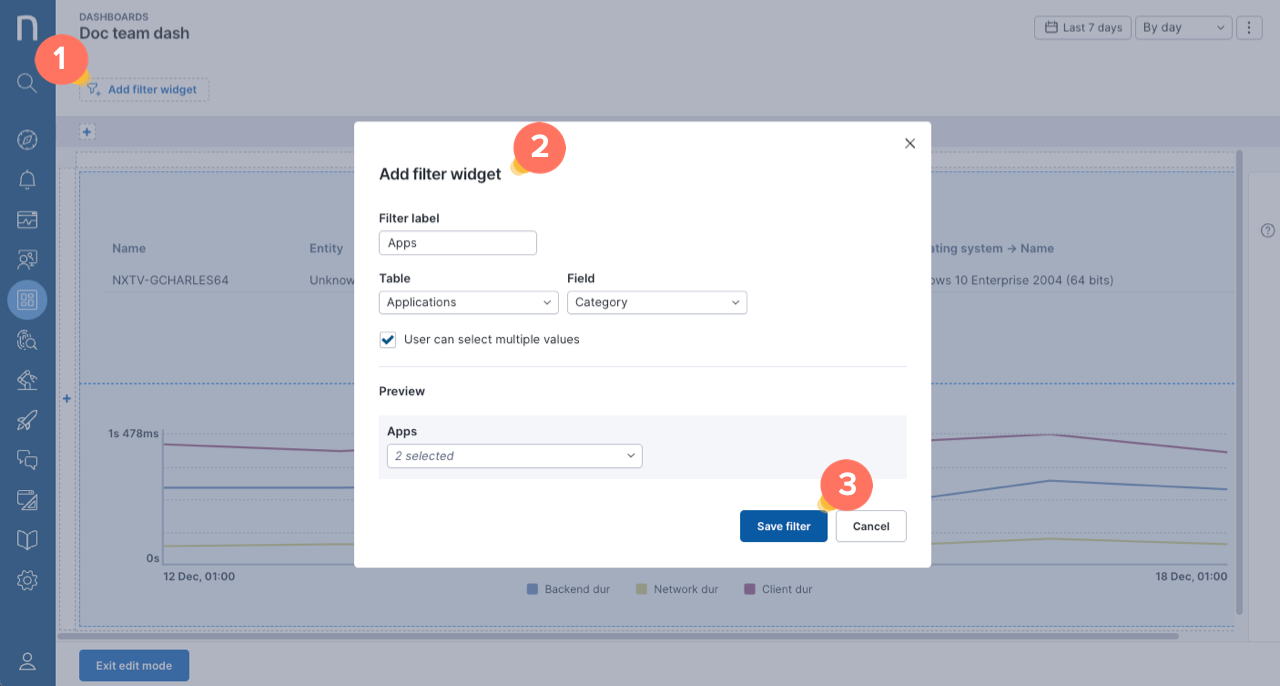
1. Click **Add filter widget** in the top-right corner of the page.
2. Fill in the Add filter widget popup to define the custom filter widget:
* **Filter label**: provide a meaningful label for the filter widget.
* **Table** and **Field**: select the NQL table and field to populate the filter’s drop-down menu.
* **User can select multiple values:** tick this option to enable users to select one or multiple values from the filter's drop-down menu.
3. **Save filter** and **Exit edit mode** to use widget filters.
{% hint style="info" %}
Filter widgets operate on a dashboard level and apply to charts in all dashboard tabs.
{% endhint %}
#### **Managing widget filters**
To manage widget filters in edit mode:
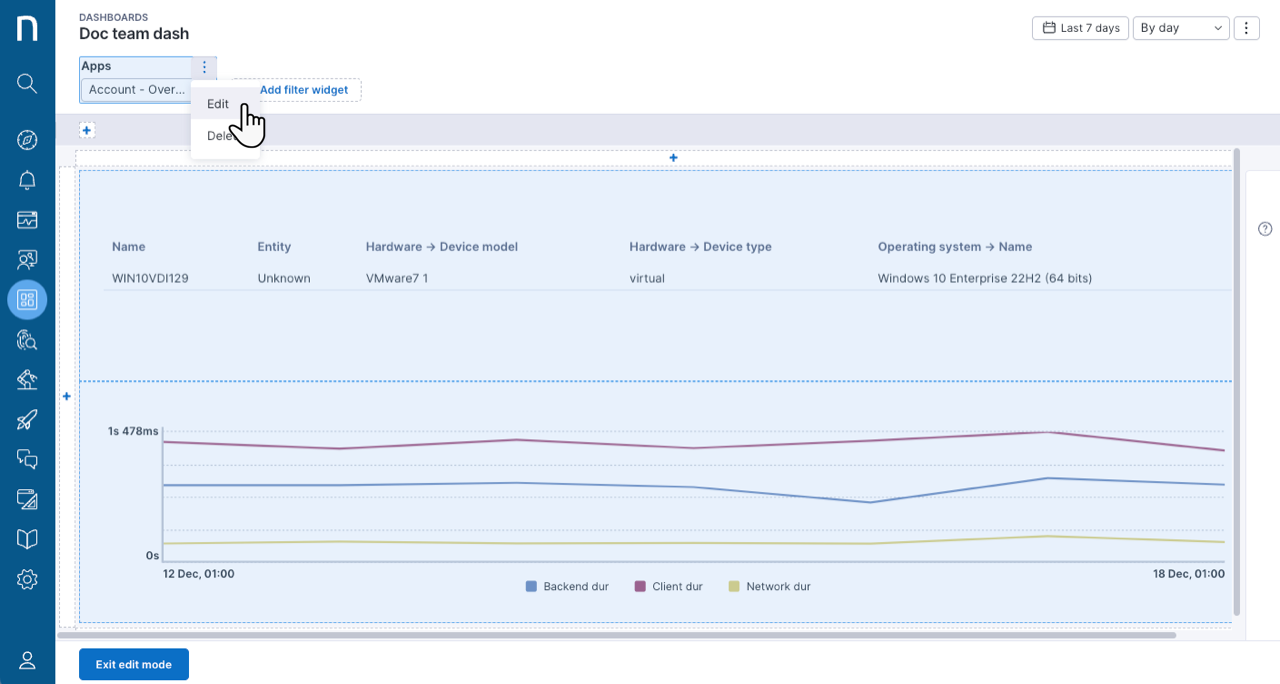
1. Hover over the top-right corner of the filter widget to open the action menu.
2. Select the **Edit** or **Delete** option.
3. Click **Exit edit mode** to save changes.
To change the position of a widget filter in the Nexthink web interface, delete the filter and then add it back into the desired position.
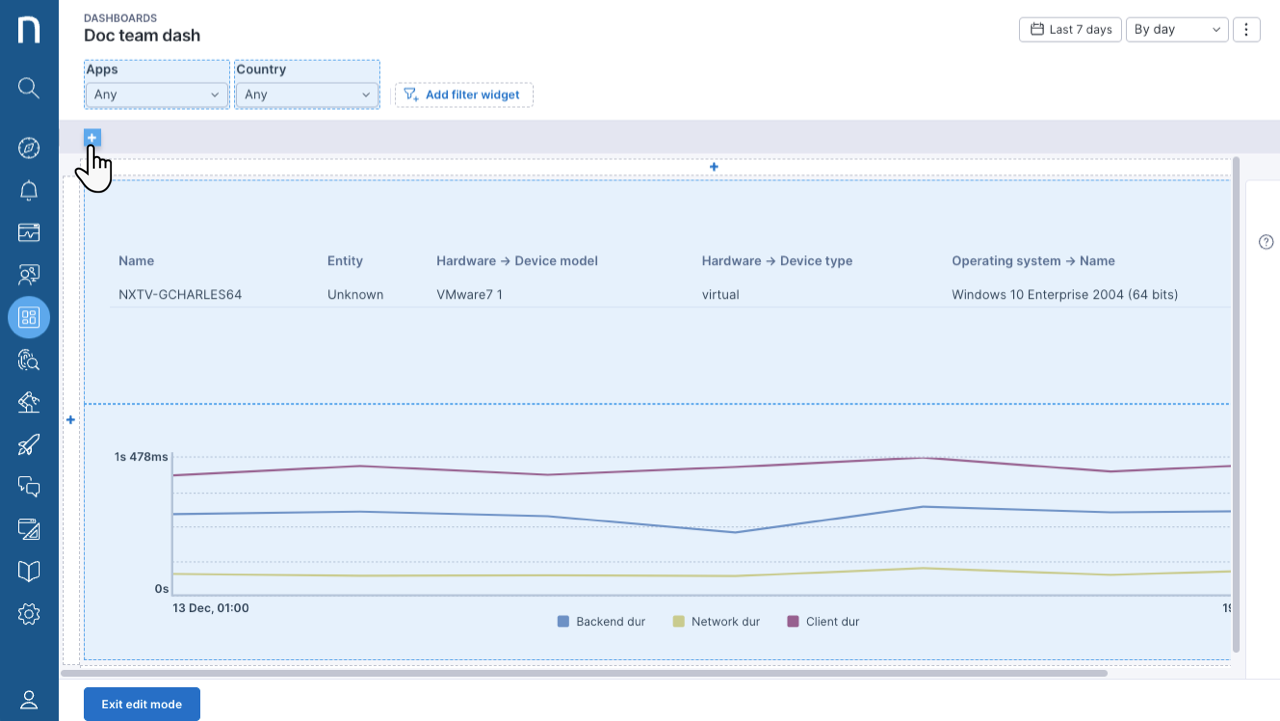
#### **Adding tabs**
Further organize widgets by adding tabs to the dashboard. Each tab can contain different sets of widgets and layouts.
To add tabs in edit mode:
1. Click on the **+** icon below the filter bar to add a tab.
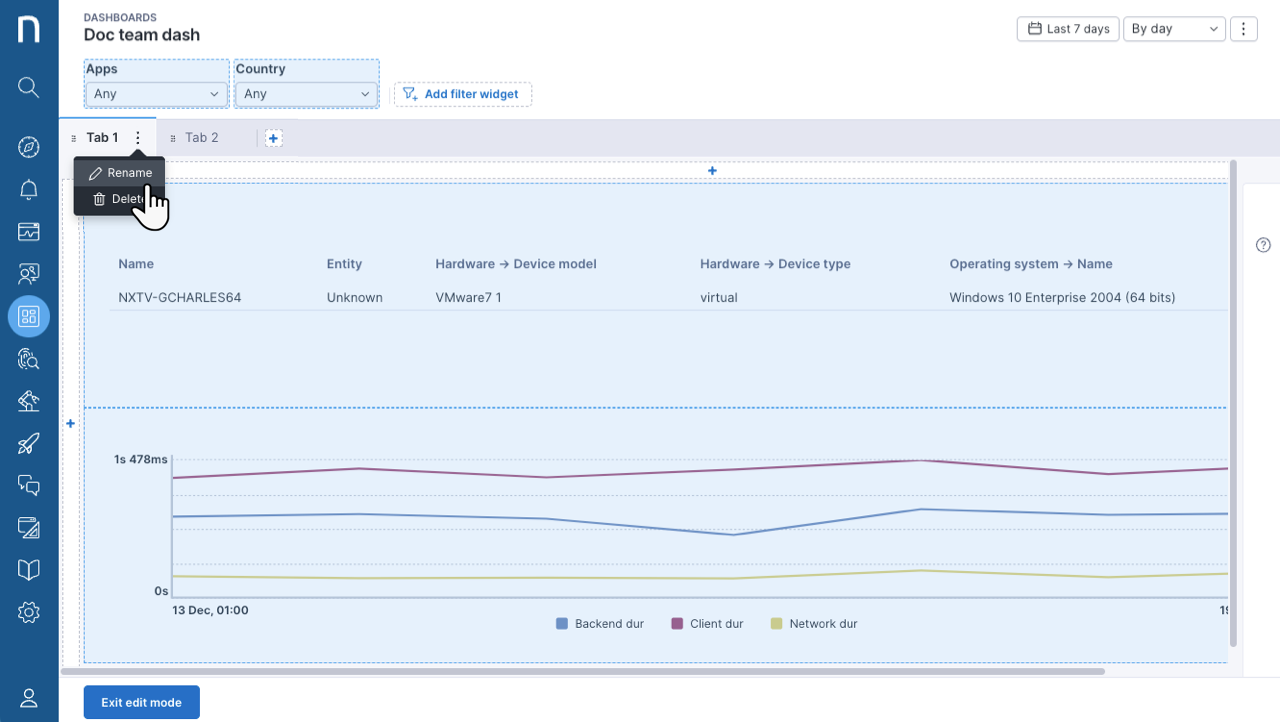
2. Use the tab’s action menu to rename or delete a tab.
3. Click and drag on individual tabs to reorder them.
4. Click **Exit edit mode** to save changes.
When adding tabs to a dashboard, consider the following:
* The first tab you create takes on the layout of all existing widgets in your dashboard.
* Add up to 8 tabs in total.
* The system exclusively runs the NQL query of the currently selected tab.
* The [timeframe picker](/platform/~/changes/Sh4xqs4GDClkDKT9Hvux/user-guide/live-dashboards/widget-types/timeframe-picker.md) and filters operate on a dashboard level and apply to charts in all tabs.
#### **Managing tabs**
To manage tabs in edit mode:
1. Hover over the tab and click on the action menu.
2. Choose the **Rename** or **Delete** option.
3. Click **Exit edit mode** to save changes.
When managing tabs, consider the following:
* Deleting the last remaining tab removes the tab, but keeps all widgets/visualizations.
* If there are multiple tabs, deleting a tab deletes all widgets on that tab and removes the tab.
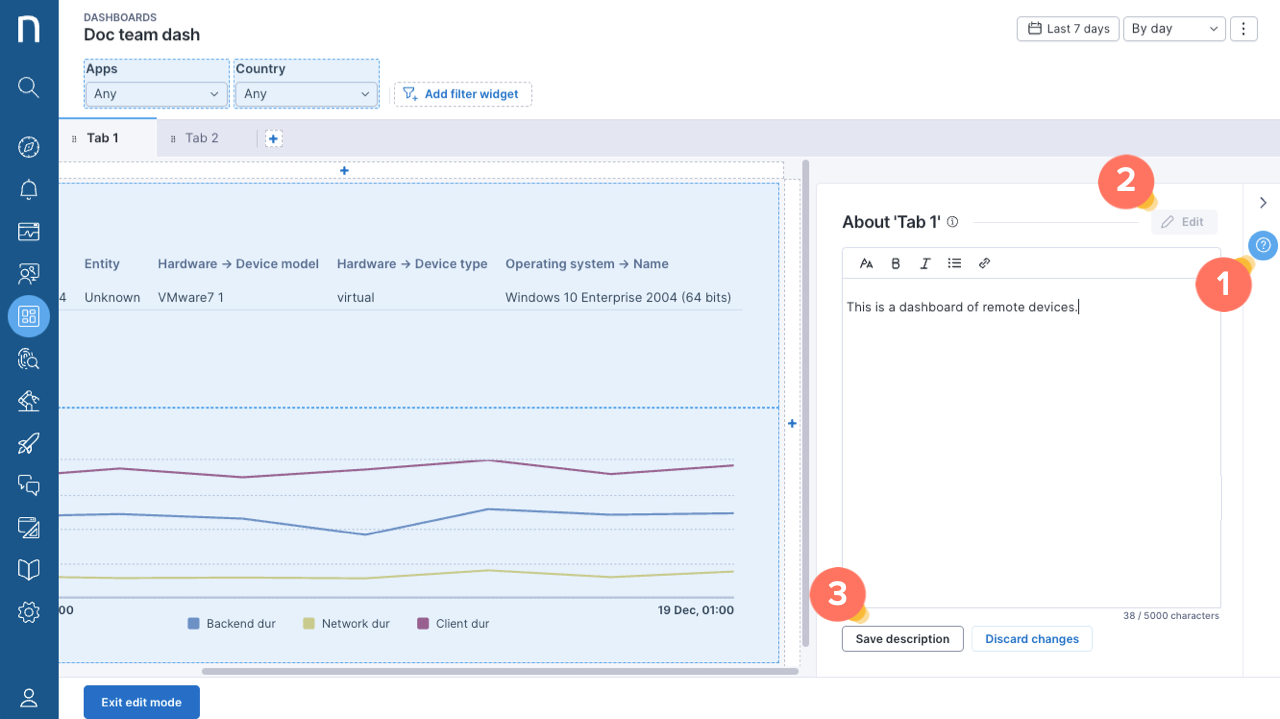
#### **Adding tab descriptions**
Tab descriptions allow you to communicate the purpose of the dashboard to other users by providing details of how to interpret and use the data in a specific tab.
To add tab descriptions in edit mode:
1. Click on the **question mark** on the right side of the Nexthink web interface.
2. After the bar expands, click **Edit** to add text.
3. **Save** the tab description.
4. Click **Exit edit mode** to save changes.
When adding tab descriptions, consider the following:
* There is a rich text editor with the following features: font size, bold, italics, bullets, links.
* Descriptions are tab-specific.
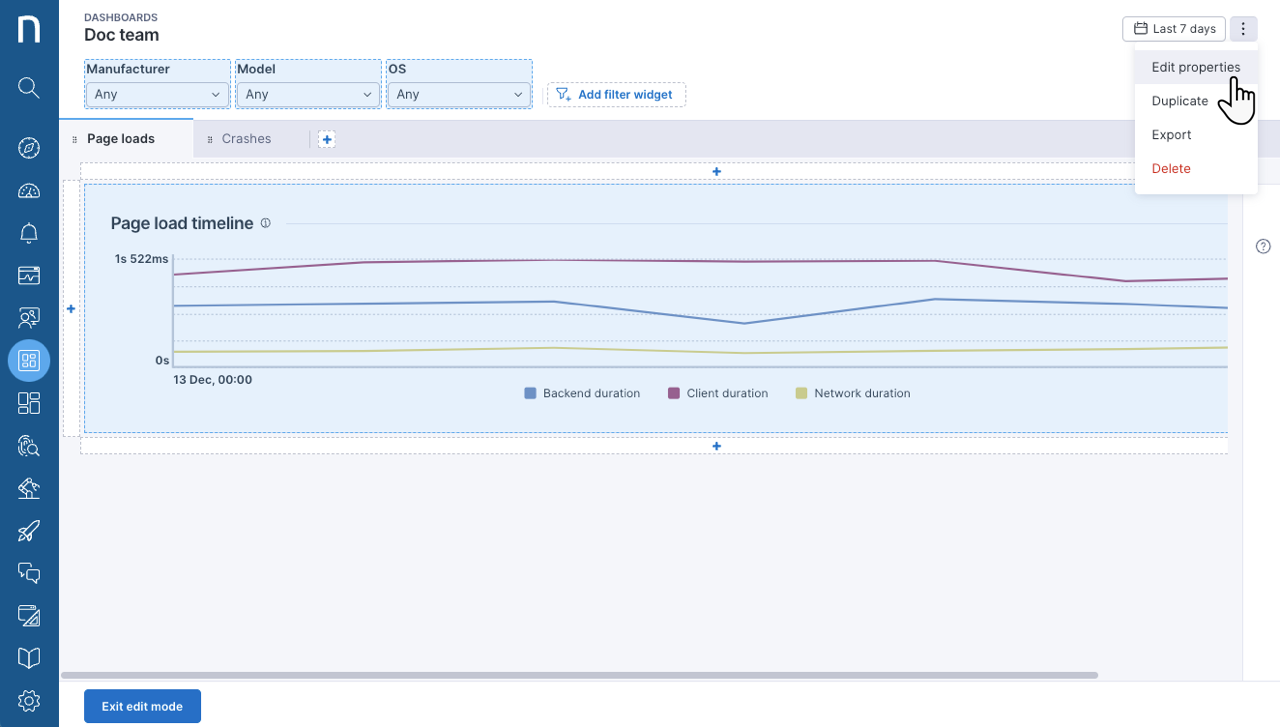
### **Renaming a dashboard and changing its properties**
To rename a dashboard or one of its properties in edit mode:
1. Hover and click on the action menu in the top-right corner of the page.
2. Choose the **Edit properties** option.
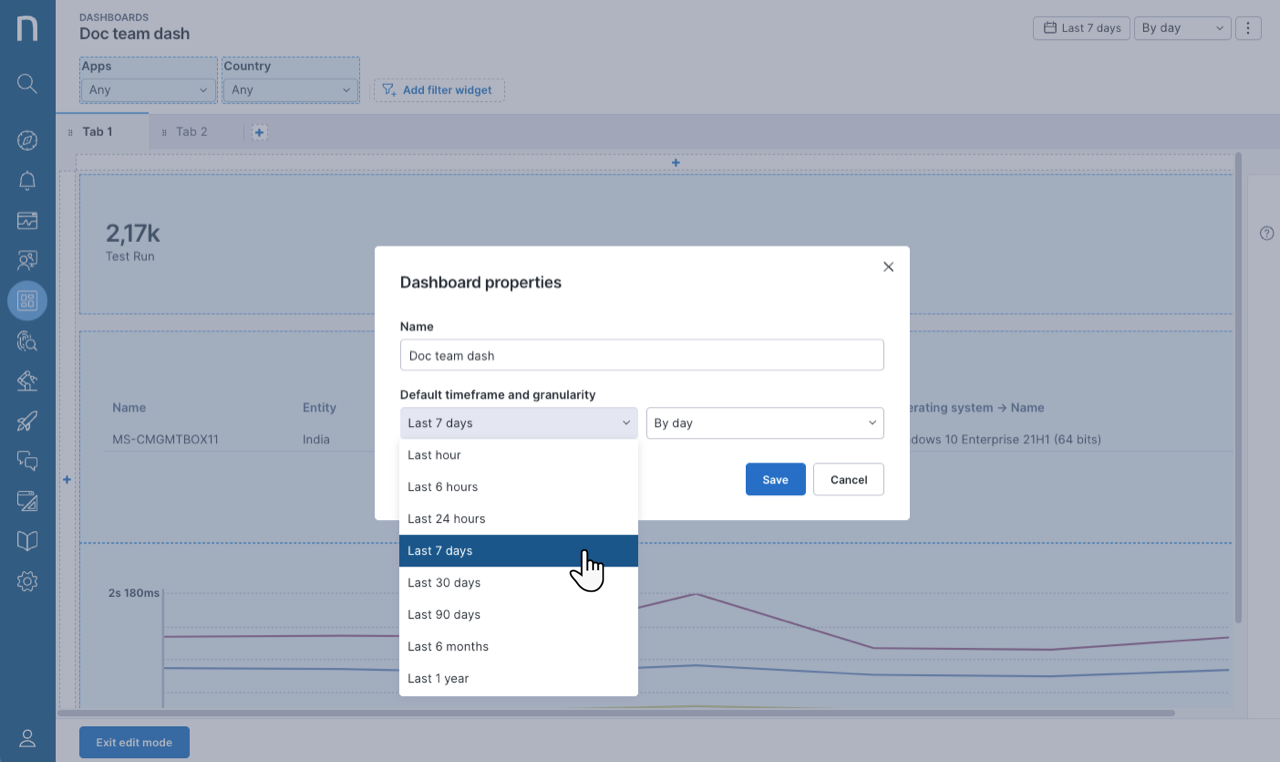
3. Fill in the fields in the **Dashboard properties** pop-up:
* **Name**: This field allows you to rename the dashboard.
* **Default timeframe and graularity**: This drop-down allows you to set the default timeframe and granularity to apply when a user opens and loads the dashboard. The global default timeframe is **Last 7 days**.
{% hint style="info" %}
Refer to the [Using Live Dashboards](/platform/~/changes/Sh4xqs4GDClkDKT9Hvux/user-guide/live-dashboards/using-live-dashboards.md) documentation to learn how to use the timeframe picker.
{% endhint %}
### Duplicating a dashboard
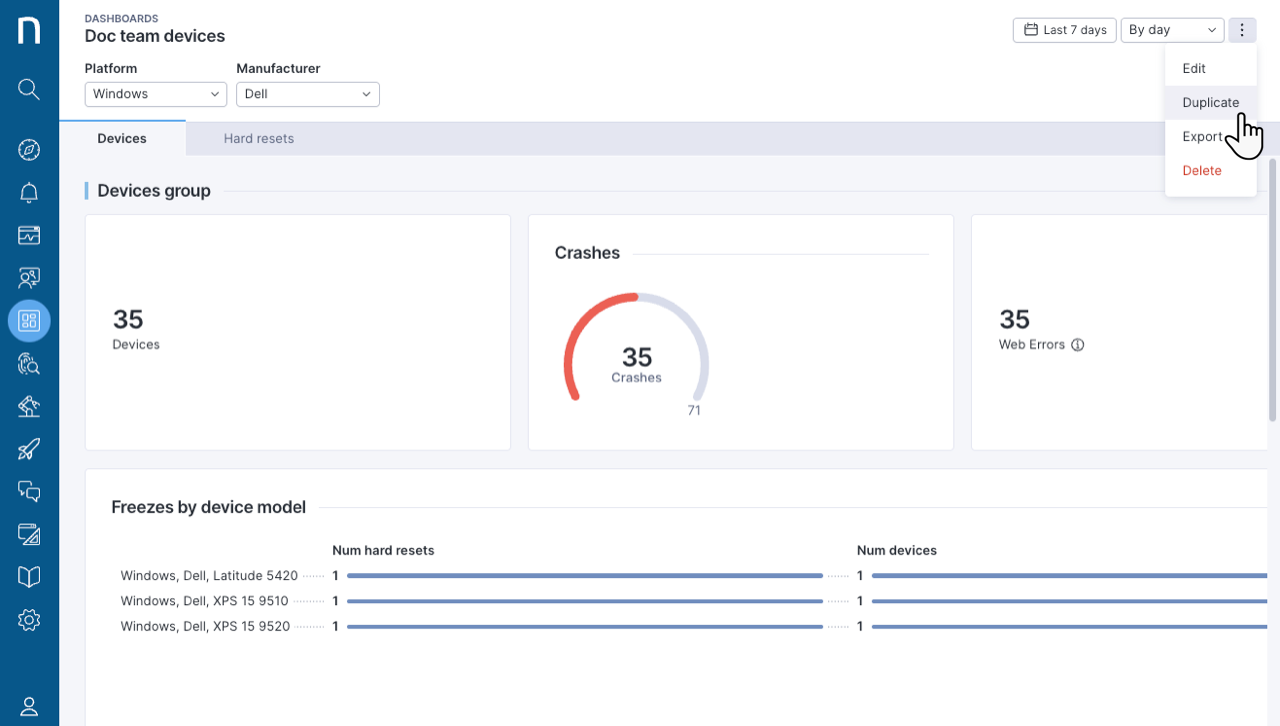
To duplicate a dashboard, click on a dashboard’s name from the Live Dashboards main menu or navigate to the **Dashboards** page by clicking the **Manage live dashboards** button.
From the dashboard page:
1. Click on the action menu in the top-right corner of the page.
2. Choose the **Duplicate** option from the action menu.
{% hint style="info" %}
Duplicating a dashboard opens the new, duplicate copy with an automatically generated name.
{% endhint %}
### Exporting an existing dashboard
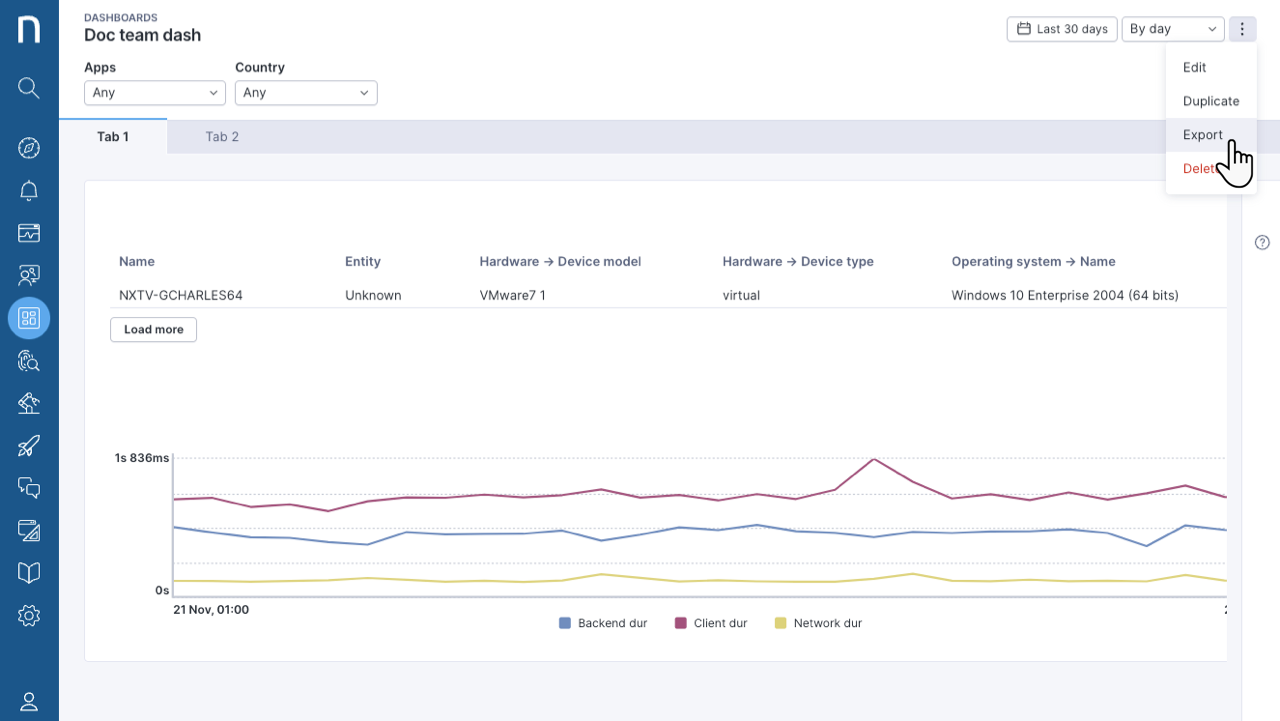
To export a dashboard, click on a dashboard’s name from the Live Dashboards main menu or navigate to the **Dashboards** page by clicking the **Manage live dashboards** button.
From the dashboard page:
1. Click on the action menu in the top-right corner of the page.
2. Choose the **Export** option from the action menu. The system exports dashboards as JSON files.
## Sharing dashboards
If you have Manage all dashboards permissions, you can share dashboards with users who don’t have Live Dashboards access.
Refer to the [Roles](/platform/~/changes/Sh4xqs4GDClkDKT9Hvux/user-guide/administration/account-management/roles.md) documentation to learn how to manage Live Dashboards permissions.
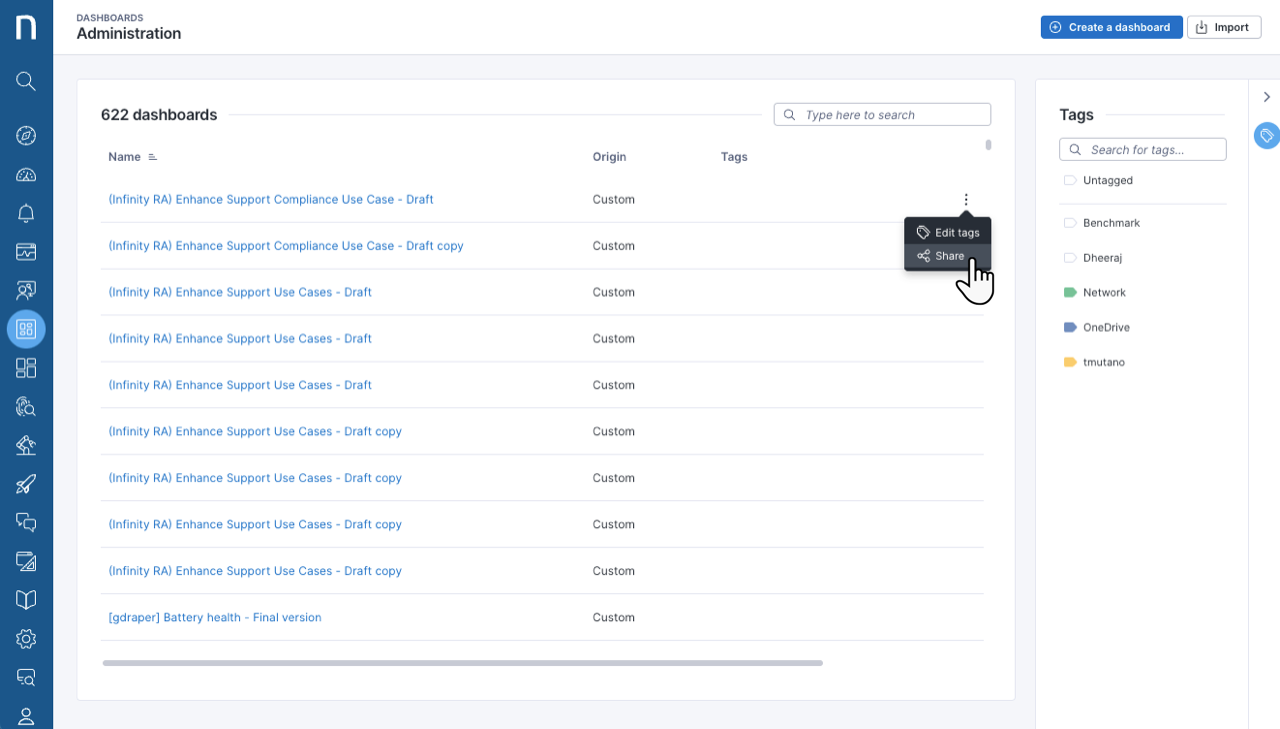
To share a dashboard:
1. Navigate to **Live Dashboards** > **Manage live dashboards**.
2. Hover over a dashboard to reveal the action menu on the right side of the table.
3. Choose the **Share** option.
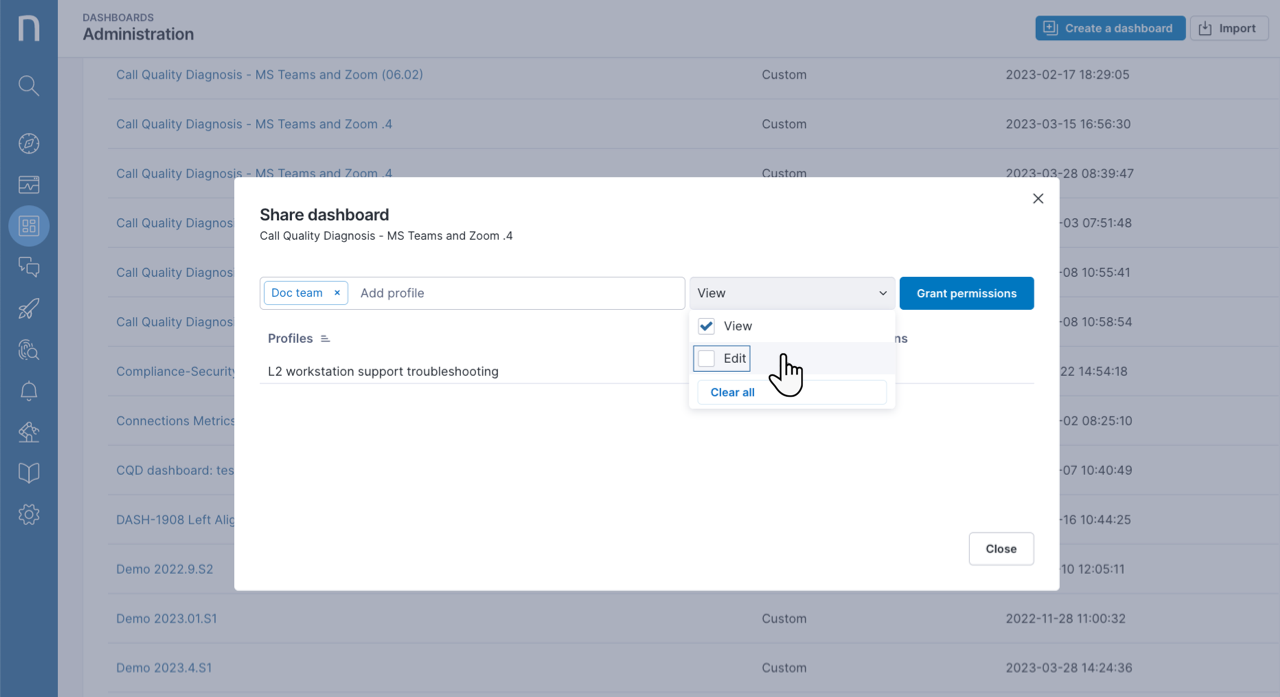
4. Fill in the **Share dashboard** pop-up:
* Add the profile you wish to share the dashboard with.
* Select permissions for the profile from the drop-down menu. The options are **View** or **Edit**.
* Click **Grant permissions** to add them to the dashboard list.
Giving Edit permissions does not grant View permissions. Both permissions are required for editing rights.
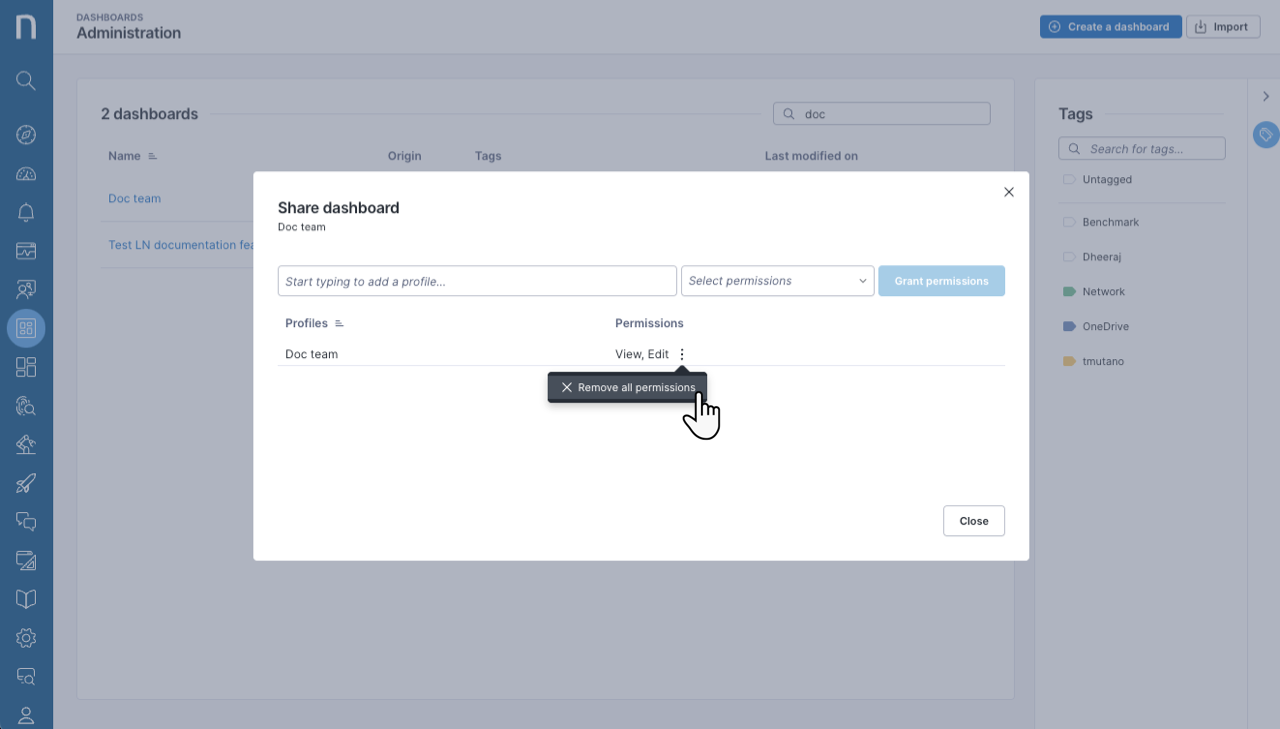
In the **Share dashboard** pop-up, you can view the profiles with access to the dashboard. To remove permissions for a specific profile:
* Hover over the permissions column of a profile to reveal the action menu.
* Click **Remove all permissions**.
### Scenarios for shared dashboard permissions
| User profile | Shared | Access |
| ---------------------------------- | ---------------------------------------------------------------------------------------------------------------------------------------- | ---------------------------------------------------------------------------------------------------------------------------------------------------------------------------------------------------------------------------------------------------------------------------------------------------------------------------------------------------------------------------------------------------------------------------------------------------------------------------------------------------------------------------------------------------- |
| No permissions for Live Dashboards | No | No access, the **Live Dashboards** module doesn’t appear in the main menu. |
| No permissions for Live Dashboards |
Dashboard 1
View permission
|
The Live Dashboards module appears in the main menu.
Dashboard 1 appears in the navigation panel.
The Manage live dashboards link is not visible in the navigation panel.
|
| No permissions for Live Dashboards |
Dashboard 1
View permission
Dashboard 2
Edit permission
|
The Live Dashboards module appears in the main menu.
Dashboard 1 and Dashboard 2 appear in the navigation panel.
The Manage live dashboards link appears in the navigation panel.
Dashboard 1 and Dashboard 2 appear on the Dashboard administration page, however the user cannot create or import dashboards.
User can view Dashboard 1 but cannot edit, duplicate or export it.
User can view and edit Dashboard 2 but cannot duplicate or export it.
|
### Share dashboard permissions reference table
#### Built-in dashboards
By default, the edit option for built-in dashboard is disabled.
Profile permission
Shared permission
Can view a dashboard , Dashboard listed in the menu
Can duplicate a dashboard
Can import a dashboard
Can share a dashboard
Can access Manage Live Dashboards
Can delete or export a dashboard
Manage all dashboards
Edit
Yes
Yes
Yes (imported as custom)
Yes
Yes
Yes
Manage all dashboards
View
Yes
Yes
Yes (imported as custom)
Yes
Yes
Yes
Manage all dashboards
None
Yes
Yes
Yes (imported as custom)
Yes
Yes
Yes
View all dashboards
Edit
Yes
No
No
No
Yes
Yes
View all dashboards
View
Yes
No
No
No
No
No
View all dashboards
None
Yes
No
No
No
No
No
None
Edit
Yes
No
No
No
Yes
Yes
None
View
Yes
No
No
No
No
No
None
None
No
No
No
No
No
No
#### Custom dashboards
Profile permission
Shared permission
Can view a dashboard, Dashboard listed in the menu
Can create or duplicate a dashboard
Can import a dashboard
Can share a dashboard
Can access Manage Live Dashboards
Can edit, delete or export a dashboard
Manage all dashboards
Edit
Yes
Yes
Yes
Yes
Yes
Yes
Manage all dashboards
View
Yes
Yes
Yes
Yes
Yes
Yes
Manage all dashboards
None
Yes
Yes
Yes
Yes
Yes
Yes
View all dashboards
Edit
Yes
No
No
No
Yes
Yes
View all dashboards
View
Yes
No
No
No
No
No
View all dashboards
None
Yes
No
No
No
No
No
None
Edit
Yes
No
No
No
Yes
Yes
None
View
Yes
No
No
No
No
No
None
None
No
No
No
No
No
No
***
RELATED TOPICS
* [Using Live Dashboards](/platform/~/changes/Sh4xqs4GDClkDKT9Hvux/user-guide/live-dashboards/using-live-dashboards.md)
* [Widget types](/platform/~/changes/Sh4xqs4GDClkDKT9Hvux/user-guide/live-dashboards/widget-types.md)
---
# Agent Instructions
This documentation is published with GitBook. GitBook is the documentation platform designed so that both humans and AI agents can read, navigate, and reason over technical content effectively. Learn more at gitbook.com.
## Querying This Documentation
If you need additional information that is not directly available in this page, you can query the documentation dynamically by asking a question.
Perform an HTTP GET request on the current page URL with the `ask` query parameter, and the optional `goal` query parameter:
```
GET https://docs.nexthink.com/platform/~/changes/Sh4xqs4GDClkDKT9Hvux/user-guide/live-dashboards/managing-live-dashboards.md?ask=&goal=
```
`ask` is the immediate question: it should be specific, self-contained, and written in natural language.
`goal` is optional and describes the broader end goal you are ultimately trying to accomplish on behalf of the user. GitBook uses it to tailor the answer towards what is most useful for that goal.
The response will contain a direct answer to the question and relevant excerpts and sources from the documentation.
Use this mechanism when the answer is not explicitly present in the current page, you need clarification or additional context, or you want to retrieve related documentation sections.
 button next to the NQL query to reveal a tooltip to write a query.