> For the complete documentation index, see [llms.txt](https://docs.nexthink.com/platform/llms.txt). Markdown versions of documentation pages are available by appending `.md` to page URLs; this page is available as [Markdown](https://docs.nexthink.com/platform/~/changes/Sh4xqs4GDClkDKT9Hvux/user-guide/alerts-and-diagnostics/getting-started-with-diagnostics/additional-dashboards.md).
# Additional dashboards
Nexthink provides out-of-the-box dashboards to diagnose common IT issues. The dashboards include AI capabilities, visualizations and advanced metrics.
## Accessing the dashboards
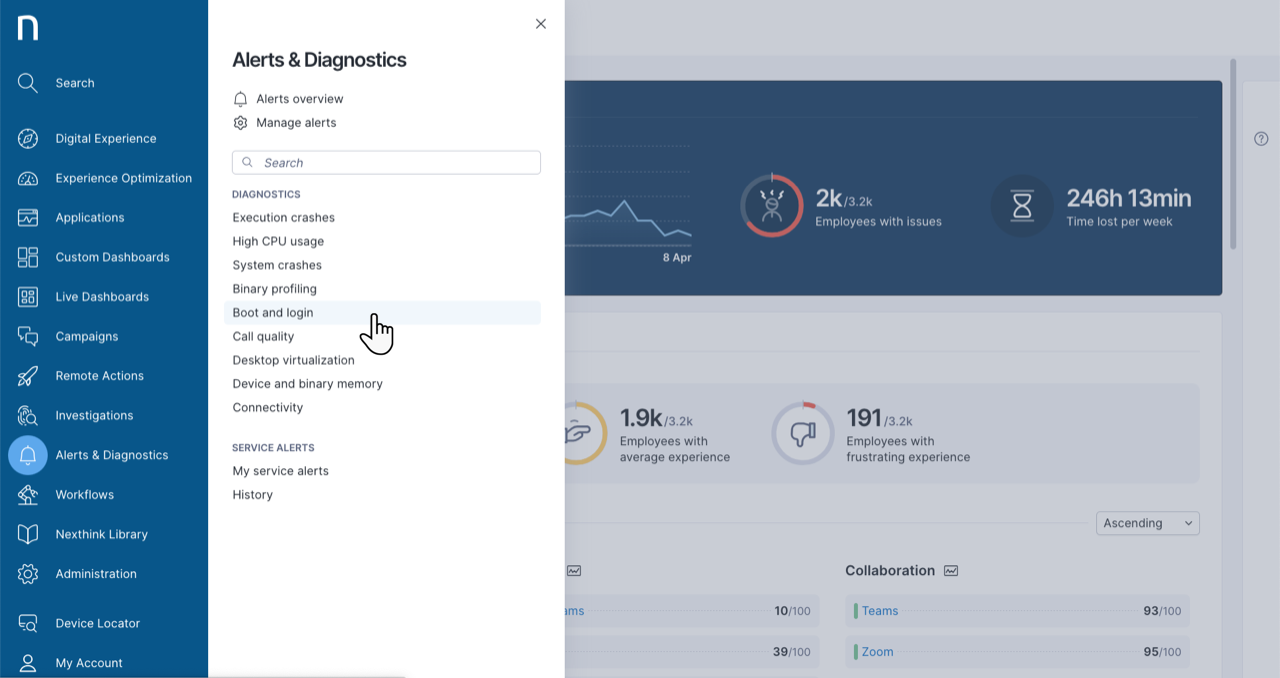
* Select **Alerts and Diagnostics** from the main menu.
* The dashboards appear under the Diagnostics section of the navigation panel.
### Considerations
* You must install Call quality and Desktop virtualization dashboards from the [Nexthink Library](/platform/~/changes/Sh4xqs4GDClkDKT9Hvux/user-guide/nexthink-library.md) module because they require data that the system doesn’t collect by default. Once you have installed these dashboards, you cannot remove them.
* Some dashboards require running specific remote actions to get more advanced insights.
## Boot and login
This dashboard requires the following remote actions:
* Get login details
* Get Gpo Startup Impact
* Get Startup Impact
Long boot and login times are common issues that hinder employee productivity. In most cases, boot and login performance is impacted by group policies and long application startup time. With this dashboard, you can:
* Assess the impact of Group Policy Objects (GPOs) on device boot and login.
* Identify applications launching at startup and their impact on the login time.
* Get actionable insights to remediate the issue using existing remote actions, which, for example, can remove applications from the startup folder.
This dashboard enables advanced troubleshooting of the following metrics:
* Boot duration
* Time until the desktop is visible
* Time until the desktop is ready
## Desktop virtualization
This dashboard is based on data retrieved from the Citrix connector. Refer to the [Desktop Virtualization Optimization](https://docs.nexthink.com/library/desktop-virtualization-optimization) library pack documentation for more information.
## Device and binary memory
Memory issues can have a major impact on employee experience when employee devices or applications run slower, freeze or even crash.
This dashboard uses advanced metrics such as memory usage, cached memory and memory swap rate to find devices suffering from memory issues.
With multidimensional breakdowns, correlate memory issues with device models or installed memory to take action and remedy the situation.
The dashboard displays applications and binaries that are consuming the most memory. As a preventive measure, send campaigns to educate employees about their device and application use.count
## Device performance troubleshooting
This dashboard uses Live dashboard technology to prioritize and troubleshoot issues related to device performance. It guides addressing employee experience issues related to CPU and device memory problems. Multiple sections address specific potential root causes of the issues.
You can access this dashboard proactively from the Diagnostics menu or the Digital Experience module.
## Wi-fi Connectivity
Poor device connectivity, such as slow web applications, poor call quality and interrupted internet connections, is the source of many issues impacting employee experience. As the *work from anywhere* paradigm has become the norm, connectivity now stands at the center of the employee experience.
This dashboard displays the networks and access points at which devices have poor Wi-Fi connectivity in the office and at home. It allows end-user computing and network teams to take actions, such as optimizing or replacing access points in the office, or sending campaigns to educate employees about best practices for home connectivity.
## Battery Health
The Battery Health dashboard is designed to identify devices with subpar battery health and short battery life. With this dashboard, you can make informed decisions and take timely actions to ensure employee laptops remain efficient and dependable. Effective battery health management improves employee productivity and experience, helps your organization save on expenses, and reduces environmental impact.
The Battery Health dashboard relies on the pre-installed *Get Battery Status* remote action that needs to be scheduled to collect and display the data in the dashboard.
If run on Windows devices, this remote action assesses the battery's condition, reporting its remaining capacity, the count of charge cycles to date, and the estimated lifespan per full charge. It additionally retrieves the current power plan in use.
For macOS devices, the remote action determines the battery's health status in a metric format with either “Normal” or “Service Recommended” status.
***
RELATED TOPICS:
* [Getting started with Diagnostics](/platform/~/changes/Sh4xqs4GDClkDKT9Hvux/user-guide/alerts-and-diagnostics/getting-started-with-diagnostics.md)
* [Collaboration Experience](/platform/~/changes/Sh4xqs4GDClkDKT9Hvux/user-guide/collaboration-experience.md)
* [Desktop Virtualization Optimization](https://docs.nexthink.com/library/desktop-virtualization-optimization)
* [Nexthink Library](/platform/~/changes/Sh4xqs4GDClkDKT9Hvux/user-guide/nexthink-library.md)
---
# Agent Instructions
This documentation is published with GitBook. GitBook is the documentation platform designed so that both humans and AI agents can read, navigate, and reason over technical content effectively. Learn more at gitbook.com.
## Querying This Documentation
If you need additional information that is not directly available in this page, you can query the documentation dynamically by asking a question.
Perform an HTTP GET request on the current page URL with the `ask` query parameter, and the optional `goal` query parameter:
```
GET https://docs.nexthink.com/platform/~/changes/Sh4xqs4GDClkDKT9Hvux/user-guide/alerts-and-diagnostics/getting-started-with-diagnostics/additional-dashboards.md?ask=&goal=
```
`ask` is the immediate question: it should be specific, self-contained, and written in natural language.
`goal` is optional and describes the broader end goal you are ultimately trying to accomplish on behalf of the user. GitBook uses it to tailor the answer towards what is most useful for that goal.
The response will contain a direct answer to the question and relevant excerpts and sources from the documentation.
Use this mechanism when the answer is not explicitly present in the current page, you need clarification or additional context, or you want to retrieve related documentation sections.