> For the complete documentation index, see [llms.txt](https://docs.nexthink.com/platform/llms.txt). Markdown versions of documentation pages are available by appending `.md` to page URLs; this page is available as [Markdown](https://docs.nexthink.com/platform/~/changes/Sh4xqs4GDClkDKT9Hvux/user-guide/applications/monitoring-applications/monitoring-desktop-applications.md).
# Monitoring desktop applications
Many critical business applications have a desktop version installed on employee devices, for example, Teams or Office 365. With Desktop Applications, better assess and manage digital employee experience (DEX) using desktop versions of the software, proactively troubleshoot potential issues and optimize software adoption and employee sentiment.
Desktop Applications allows you to:
* Configure desktop applications with binaries.
* Access out-of-the-box dashboards for usage and performance of desktop applications.
* Spot application issues and investigate them further.
* Use the **Desktop** tab > **Network** tab to troubleshoot network-related issues specific to desktop applications. See [Monitoring Desktop Applications ](#monitoringdesktopapplications-monitoringdesktopapplicationsmonitoringdesktopapplications)on this page.
* Get qualitative data on employee sentiment.
* Set up hybrid monitoring of web and desktop versions and manage them from one familiar user interface.
## Configuring desktop applications
Refer to the [Manage Applications](/platform/~/changes/Sh4xqs4GDClkDKT9Hvux/user-guide/applications/managing-applications.md) documentation to learn how to configure desktop applications in Nexthink web interface.
## Monitoring desktop applications
From the chosen application page, open the **Desktop** tab to view and filter important metrics specific to a desktop application:
* The **Overview** tab includes dashboards for usage and performance of the desktop application.
* The **Network** tab has a[ network view](/platform/~/changes/Sh4xqs4GDClkDKT9Hvux/user-guide/network-view.md) visualization of `connection.events` data and metrics specific to the desktop application.
The **Investigate and diagnose** button, highlighted in blue on the [right-side panel](#monitoringdesktopapplications-sidepanelsidepanel) of the web interface, allows you to open filtered investigations to examine data further.
{% hint style="info" %}
Refer to the [Monitoring applications](/platform/~/changes/Sh4xqs4GDClkDKT9Hvux/user-guide/applications/monitoring-applications.md) documentation to learn about high-level monitoring of web and desktop metrics using the **Application** **Overview** page.
{% endhint %}
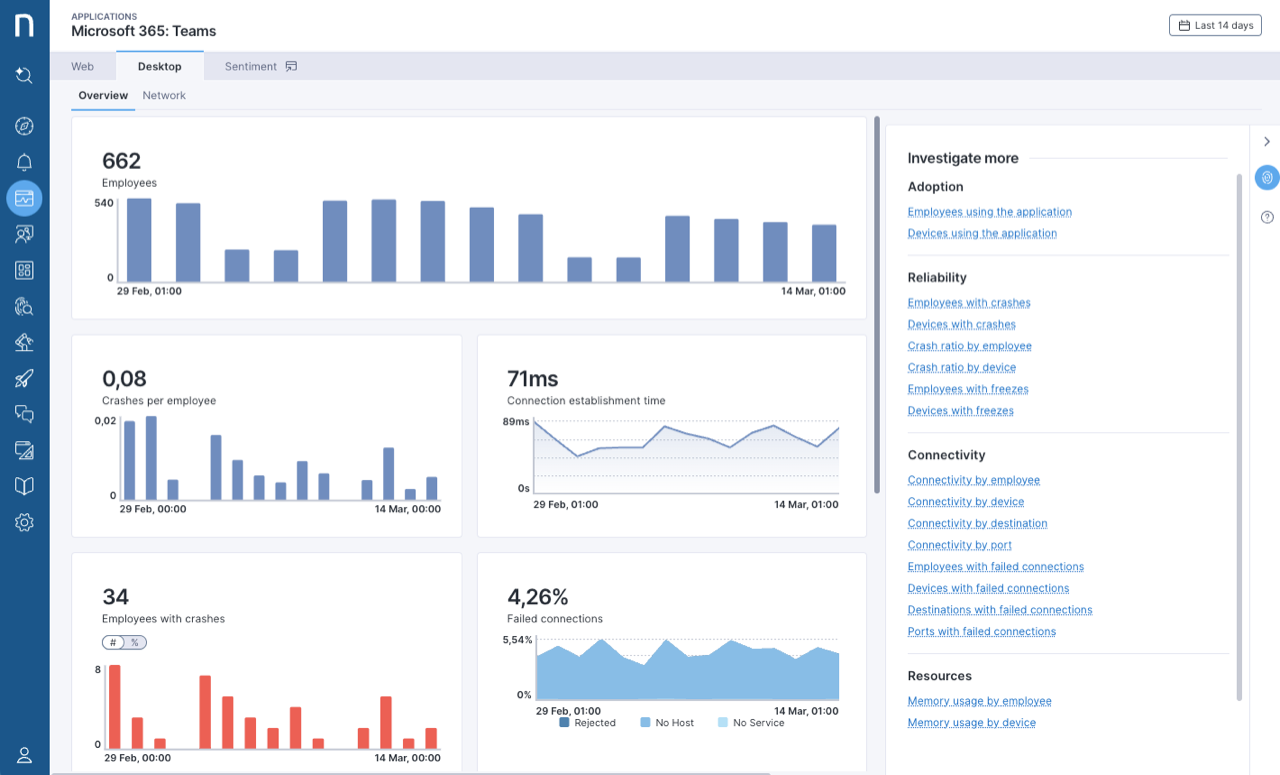
Find below the widgets on the **Desktop** tab > **Overview** tab of the chosen application page:
**Employees**
Displays the number of unique users with execution time > 0 per time bucket.
**Crashes per employee**
Displays the average number of crashes per employee using the application in a given time period.
**Employees with crashes**
Displays the total number of employees who experienced the application crash in a given time period. Use the toggle to switch between the percentage and number values.
**Connection establishment time**
Displays the average connection establishment time per time bucket. It is equal to the time taken to establish a TCP connection with the 3-way handshake.
**Failed connections**
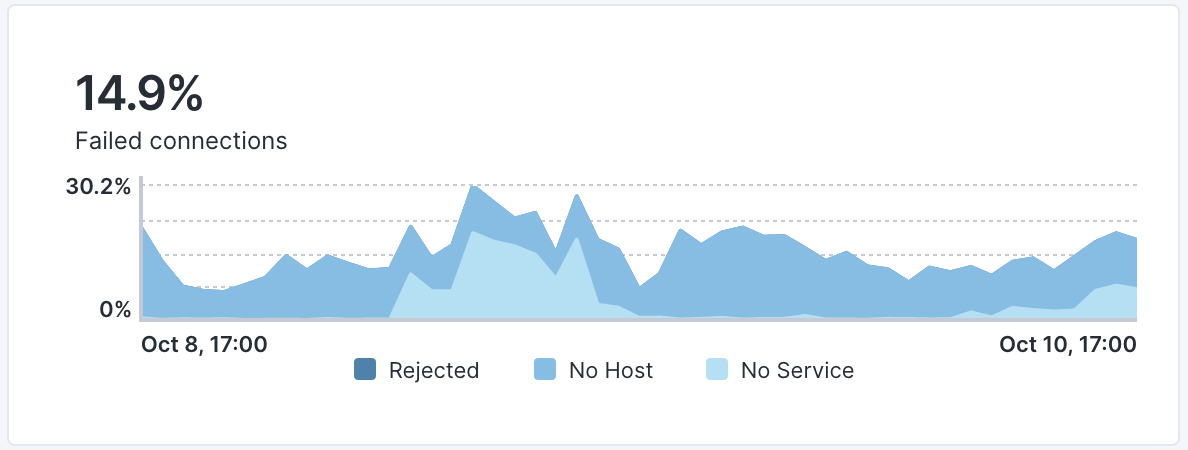
Displays the ratio of failed connections per time bucket. The system computes the ratio by dividing the number of TCP connections that failed by the ones that the devices triggered. Connections might have failed because there was no host, no service or the server rejected them.
The ratio is split among 3 different values:
* **Rejected** connections
* **No Host** connections
* **No Service** connections
Each ratio appears in a different color. Find the legend that explains each color below the widget.
**Metric breakdowns**
Analyze metric variations by **Binary**, **Operating system, Country** or **State** using the dropdown list. The system sorts the results by the **Employees** column by default. The breakdown by country and state uses the geolocation of devices feature. Refer to the [Configuring geolocation](/platform/~/changes/Sh4xqs4GDClkDKT9Hvux/user-guide/administration/system-configuration/product-configuration.md) documentation for more information. The system displays *Unknown* in the results table if the geolocation is not configured properly.
* Sort the table by other metrics by clicking on the table headers.
* Click on the action menu next to each result to filter the page. Active filters appear at the top in the filtering bar and you can remove them individually or all at once.
The values displayed in this section may vary from those displayed in the widgets above. For example, the system counts an employee who uses different versions of an application several times in this section, but only once in the **Employees** widget.
### Troubleshooting crashes in Diagnostics
Hover over **Crashes per employee** widget value to reveal the action menu. Click on the action menu and select **Troubleshoot** to diagnose issues further:
* The Diagnostic page opens in a new window for application crashes.
* It preserves the timeframe you selected on the Desktop page. However, the timeframe granularity in the Diagnostic dashboard is 1 day while on the Desktop page it can be much higher, for example, 1 hour.
* The diagnostics show results for the binaries configured for the application.
### Timeframes and time granularity
The time granularity of Desktop Applications is consistent with the timeframe selector you have chosen.
Currently, you can select timeframes for up to the **Last 14 days**.
{% hint style="info" %}
When switching from another dashboard where the selected timeframe is different from the one supported by Desktop applications, the system displays a warning message and adjusts the timeframe to **Last 48 hours.**
{% endhint %}
## Side panel
Open the right-side panel in the chosen application page by clicking **Investigate and diagnose** button highlighted in blue in the Nexthink web interface. The side panel includes:
### Investigate more
Troubleshoot applications by retrieving data about impacted employees, devices, connection establishment time, memory usage and other metrics using Nexthink Query Language (NQL). The system redirects you to the Investigations page where it automatically writes NQL queries based on the filters you have selected on the Desktop page.
### Documentation
In-product documentation helps you find information about the widgets and features you see directly in the product. Additionally, it links to references in the online documentation and Nexthink Learn.
***
RELATED TOPICS
* [Managing Applications](/platform/~/changes/Sh4xqs4GDClkDKT9Hvux/user-guide/applications/managing-applications.md)
* [Monitoring applications](/platform/~/changes/Sh4xqs4GDClkDKT9Hvux/user-guide/applications/monitoring-applications.md)
---
# Agent Instructions
This documentation is published with GitBook. GitBook is the documentation platform designed so that both humans and AI agents can read, navigate, and reason over technical content effectively. Learn more at gitbook.com.
## Querying This Documentation
If you need additional information that is not directly available in this page, you can query the documentation dynamically by asking a question.
Perform an HTTP GET request on the current page URL with the `ask` query parameter, and the optional `goal` query parameter:
```
GET https://docs.nexthink.com/platform/~/changes/Sh4xqs4GDClkDKT9Hvux/user-guide/applications/monitoring-applications/monitoring-desktop-applications.md?ask=&goal=
```
`ask` is the immediate question: it should be specific, self-contained, and written in natural language.
`goal` is optional and describes the broader end goal you are ultimately trying to accomplish on behalf of the user. GitBook uses it to tailor the answer towards what is most useful for that goal.
The response will contain a direct answer to the question and relevant excerpts and sources from the documentation.
Use this mechanism when the answer is not explicitly present in the current page, you need clarification or additional context, or you want to retrieve related documentation sections.