> For the complete documentation index, see [llms.txt](https://docs.nexthink.com/llms.txt). Markdown versions of documentation pages are available by appending `.md` to page URLs; this page is available as [Markdown](https://docs.nexthink.com/platform/ja/library-packs/vdi/microsoft/windows-365-essentials/usage-guide-windows-365-essentials.md).
# 使用ガイド:Windows 365エッセンシャル
{% hint style="warning" %}
このページでは、ユースケースの例を含め、パックのさまざまな使用方法の概要を示します。
Nexthink 管理者は、インストールされたコンテンツを設定およびカスタマイズするために、[Configuration guide: Windows 365 essentials](https://github.com/nexthink/documentation.online-product-documentation/tree/develop/ja_docs/library-packs/vdi/microsoft/windows-365-essentials/configuration-guide-windows-365-essentials.md) を参照できます。
{% endhint %}
Windows 365 essentials ライブラリパックは、EUC チームに以下を提供します:
* Cloud PC の正常性、可用性、再起動ステータス、パフォーマンス、接続 Experience を一元的に表示する Windows 365 Cloud PC 監視ダッシュボード。
* チームが対応を必要とする Cloud PC を特定し、パフォーマンスまたは接続の問題を調査して、適時に対処するのに役立つインサイト。
さらに、このライブラリパックには、Cloud PC の再起動、グループポリシーの更新、Cloud PC セッションからのログオフ、ユーザーセッション内で実行されている応答しないプロセスの終了に使用できる、事前設定済みのリモートアクションが用意されています。また、管理者が Cloud PC のパフォーマンスと可用性に影響する主要な問題を迅速に検出して対処するのに役立つ、事前設定済みの Windows 365 モニターも含まれています。
## ライブラリパックの用途
{% hint style="info" %}
このページの[使用ケース](#use-cases)にジャンプして、関連するシナリオアプリケーションを確認してください。
{% endhint %}
### Cloud PC の監視
Windows 365 監視ダッシュボードは、このライブラリパックの出発点として機能します。 Cloud PC の可用性、再起動の正常性、パフォーマンス、登録またはプロビジョニング関連のシグナル、セッション Experience を監視するための専用ビューを提供します。
#### Cloud PC の可用性の可視化
Windows 365 監視ダッシュボードの[概要]タブでは、Cloud PC のオンラインおよびオフラインのステータスを迅速に把握し、調査が必要な可能性がある領域を特定できます。
利用可能な場合は、宛先プールや VDI タイプなどのダッシュボードの内訳を使用して、問題の範囲を絞り込みます。これらの共有 VDI ディメンションは、Windows 365 Cloud PC 全体のパターンを特定するのに役立ちます。
#### Cloud PC のパフォーマンス概要
Windows 365 監視ダッシュボードの[パフォーマンスの概要]タブでは、Cloud PC 全体のハードウェア負荷とリソース使用率に焦点を当てています。エンドユーザー Experience に影響が及ぶ前に、パフォーマンスのボトルネックを特定するのに役立ちます。
このタブのテレメトリは、次の 4 つの正常性グループに分類されています:
* **CPU/GPU**: CPU キューの長さ、全体的な CPU 使用率、および利用可能な場合の GPU 使用率。
* **メモリ**: 使用可能なメモリ、キャッシュ、スワップアクティビティにより、負荷とページングを明らかにします。
* **ストレージ**: ディスクキューの長さと読み取り/書き込みレイテンシにより、ストレージの競合を可視化します。
* **ネットワーク**: 接続の失敗、接続確立の遅延、総トラフィックにより、接続性または飽和状態のパターンを明らかにします。
### Windows 365 アクセスクライアントの監視
このパックには、Windows 365 Cloud PC および Azure Virtual Desktop(AVD)環境へのアクセスの監視に使用される共有アプリケーションオブジェクトが含まれています:
* **Microsoft AVD** - Windows 365 Cloud PC および Azure Virtual Desktop トラフィックの接続性とネットワーク使用状況を可視化する、共有ネットワークアプリケーションオブジェクト。
* **Microsoft AVD client** - ユーザーが Windows 365 Cloud PC または Azure Virtual Desktop 環境に接続する際のクライアント使用状況、パフォーマンス、安定性を可視化する、共有ハイブリッド Web およびデスクトップアプリケーションオブジェクト。
これらの名前は、ライブラリパック内のインストール済みコンテンツ名を反映しています。
Web アプリケーションおよびデスクトップアプリケーションの監視について詳しくは、[ドキュメントページ](/platform/ja/user-guide/applications/monitoring-applications.md)を参照してください。
### Windows 365 の問題に対するアラートのトリガー
このライブラリパックからインストールされたモニターを使用すると、Windows 365 Cloud PC のパフォーマンス、接続性、セッション Experience に関連する重要なメトリクスを使用して問題を検出できます:
* **VDI - High percentage of disconnected sessions per desktop pool** - 頻繁または予期しない切断を特定します。
* **VDI - High CPU usage per desktop pool** - Cloud PC の潜在的なパフォーマンスボトルネックを示します。
* **VDI - High average latency per VDI client location** - 地域または場所ごとのネットワーク関連の遅延を明らかにします。
* **VDI - High number of sessions per virtual machine** - 該当する場合、過剰使用の可能性を特定するのに役立ちます。
これらのモニターによって生成されたアラートは、さらなる調査と分析のために [Alerts overview](https://docs.nexthink.com/platform/ja/user-guide/alerts-and-diagnostics/responding-to-alerts/alerts-overview) ダッシュボードに表示されます。
### Cloud PC の管理
修復用リモートアクションは、通常は専門的なサポートまたは管理ツールを必要とする一般的な Windows 365 Cloud PC の問題の解決に役立つよう提供されています。これらのアクションには、Cloud PC の再起動、グループポリシーの更新、Cloud PC セッションからのログオフ、ユーザーセッション内で実行されている応答しないプロセスの終了を含めることができます。
## ユースケース
以下に示す関連するユースケースに加えて、環境に特有の他のトラブルシューティングシナリオを発見することができるかもしれません。
### 再起動の正常性が低い Cloud PC を調査する
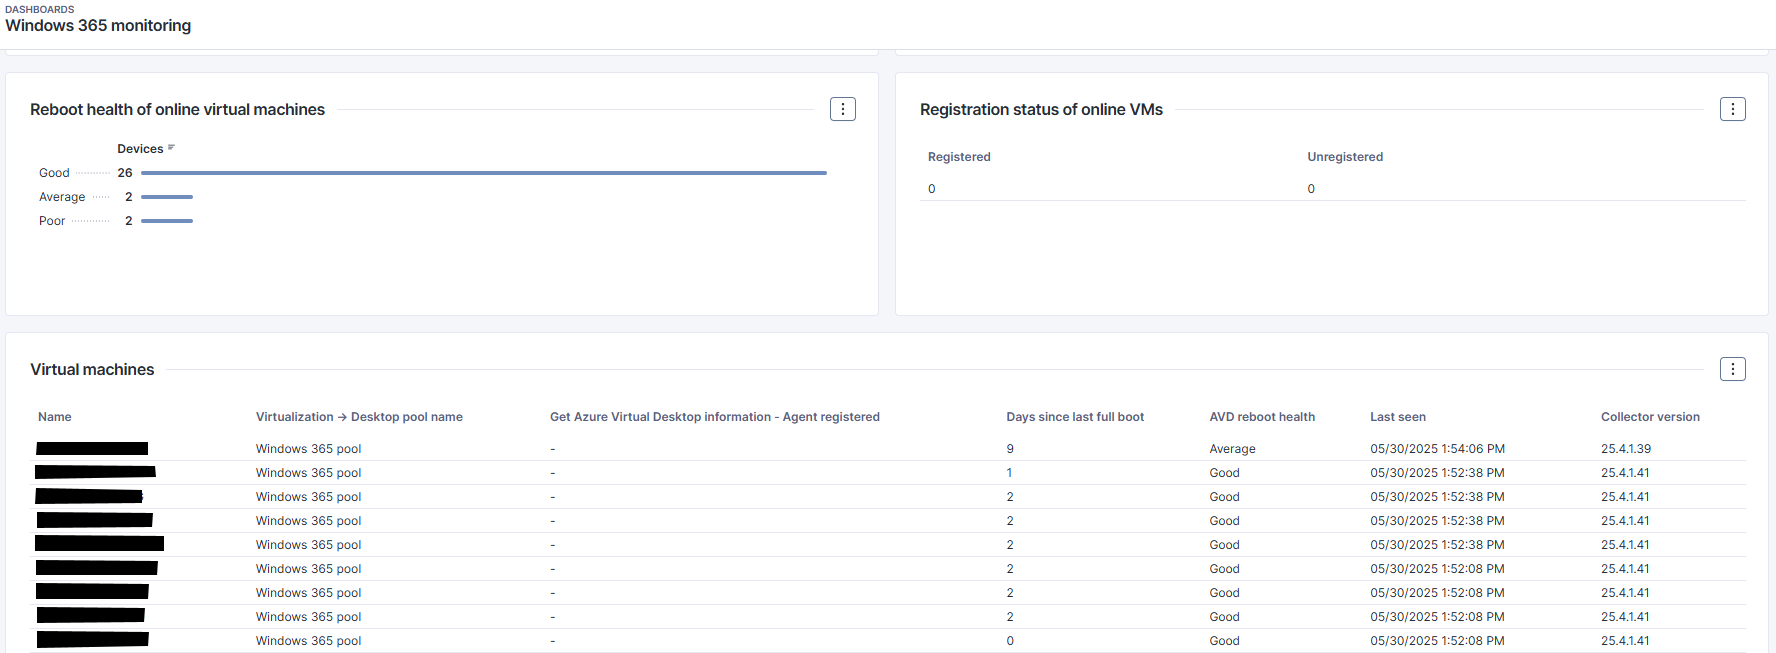
Cloud PC の再起動の正常性は、このパックに含まれる共有カスタムフィールド **AVD reboot health** によって決まります。このカスタムフィールドは共有 VDI コンテンツで使用され、Windows 365 Cloud PC と Azure Virtual Desktop 環境に適用されます。
この情報は、各カテゴリの Cloud PC 数を示す専用グラフとしてダッシュボードに要約表示されます。これを使用して、組織で想定されるポリシー期間内に再起動されておらず、調査が必要な可能性がある Cloud PC を特定します。
### 特定のオフィス拠点でレイテンシの急増を引き起こしているネットワークの混雑を検出する。
**High average latency per VDI client location** モニターは、クライアントの場所ごとの平均ネットワークレイテンシを追跡し、毎時算出される 7 日間のベースラインと比較した動的しきい値をレイテンシが超えた場合にアラートをトリガーします。
### Cloud PC に影響する CPU ボトルネックを特定する
**High CPU usage per desktop pool monitor** は、デスクトッププールの平均 CPU キュー長を追跡し、Windows 365 Cloud PC に影響する CPU 負荷を特定するのに役立ちます。
### 最適なユーザー Experience を維持するために、過負荷の Cloud PC またはプールを防止する
**High number of sessions per virtual machine** モニターは、仮想マシンごとのアクティブセッション総数を追跡し、セッション数がユーザー定義のしきい値を超えた場合にアラートをトリガーします。 Windows 365 では、これは複数のセッションまたは共有 Cloud PC の使用パターンが該当する場合に最も関連します。
### セッションの継続性に影響するネットワークの不安定性を特定する
**High percentage of disconnected sessions per desktop pool** モニターは、セッションの切断を監視し、切断されたセッションとアクティブセッションの比率を計算して、その比率が定義済みのしきい値を超えた場合にアラートをトリガーします。
---
# Agent Instructions
This documentation is published with GitBook. GitBook is the documentation platform designed so that both humans and AI agents can read, navigate, and reason over technical content effectively. Learn more at gitbook.com.
## Querying This Documentation
If you need additional information that is not directly available in this page, you can query the documentation by asking a question.
Perform an HTTP GET request on the following URL with the `ask` and `goal` query parameters:
```
GET https://docs.nexthink.com/platform/ja/library-packs/vdi/microsoft/windows-365-essentials/usage-guide-windows-365-essentials.md?ask=&goal=
```
`ask` is the immediate question: it should be specific, self-contained, and written in natural language.
`goal` is what the user is ultimately trying to achieve, the reason they need the answer. Sharing it helps GitBook give you a better, more relevant answer. A goal is most helpful when it describes the outcome the user wants rather than restating the question. For example, with `ask=how do I create an API token`, a goal like `automate deployments from our CI pipeline` lets GitBook tailor the answer to that use case.
The response will contain a direct answer to the question and relevant excerpts and sources from the documentation.
Use this mechanism when the answer is not explicitly present in the current page, you need clarification or additional context, or you want to retrieve related documentation sections.