> For the complete documentation index, see [llms.txt](https://docs.nexthink.com/platform/llms.txt). Markdown versions of documentation pages are available by appending `.md` to page URLs; this page is available as [Markdown](https://docs.nexthink.com/platform/user-guide/collaboration-experience/getting-started-with-collaboration-experience/using-collaboration-tools.md).
# Monitoring Call Quality
The **Call Quality** dashboard helps IT teams monitor, investigate, and resolve voice and video call issues across collaboration tools.
The Call Quality dashboard features a multi-tab view that highlights performance trends, technical root causes, and impacted users or devices—essential insights for efficient troubleshooting.
## Accessing Call Quality dashboard
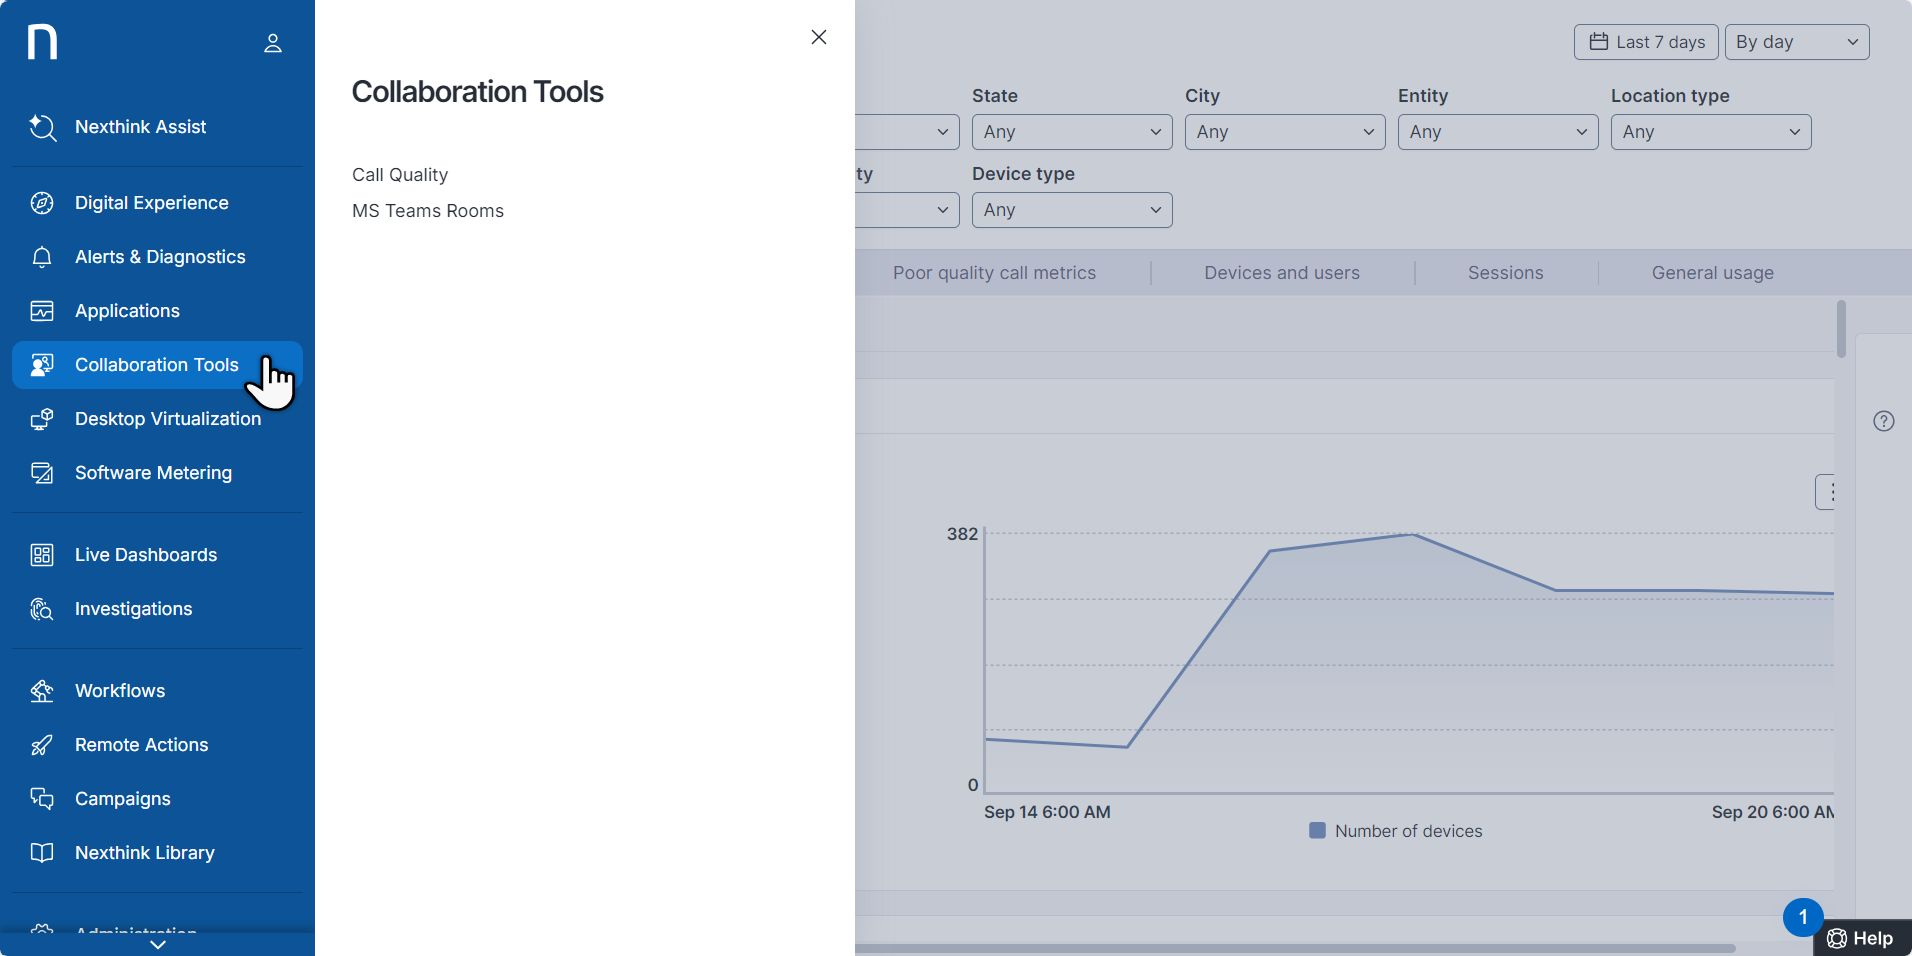
From the main menu, select **Collaboration Tools > Call quality**.
## Filtering and action menu in the Call Quality dashboard
#### Timeframe
Use the timeframe picker at the top of the dashboard to select a predefined or custom time range and adjust the data granularity. Changes to the selected granularity affect only line charts and do not impact aggregated metrics or tables.
#### Filters
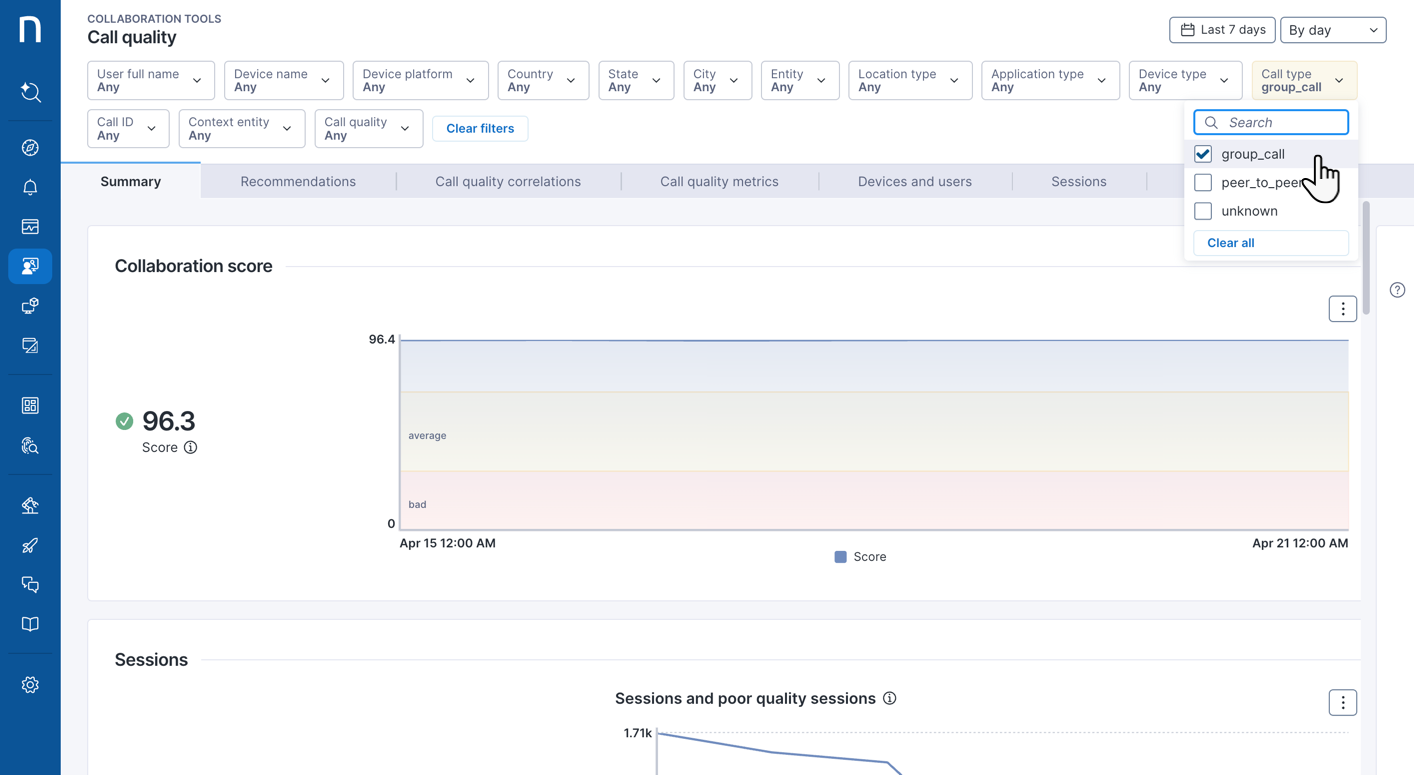
Use the available filters to narrow the scope of the data and focus your analysis on specific collaboration platforms, locations, devices, users, or other relevant dimensions. Filtering helps isolate affected populations and investigate potential causes of call quality issues.
{% hint style="warning" %}
The **Call type** filter only provides accurate data fields for Microsoft Teams, and does not have feature parity with Zoom.
Subsequently, the **Call type** widget under the[ Summary](#usingcollaborationtools-summary) tab only displays data for MS Teams.
{% endhint %}
The selected timeframe and filters are applied consistently across all dashboard tabs, enabling you to maintain context while navigating between different views.
#### Action menu
Hover over widgets to display the action menu. Depending on the widget type, the menu provides contextual drill-downs, access to related Investigations, and options to copy widget data.
## Using the Call Quality dashboard for troubleshooting
Explore the dashboard tabs to quickly identify and troubleshoot call quality issues.
***
### Summary
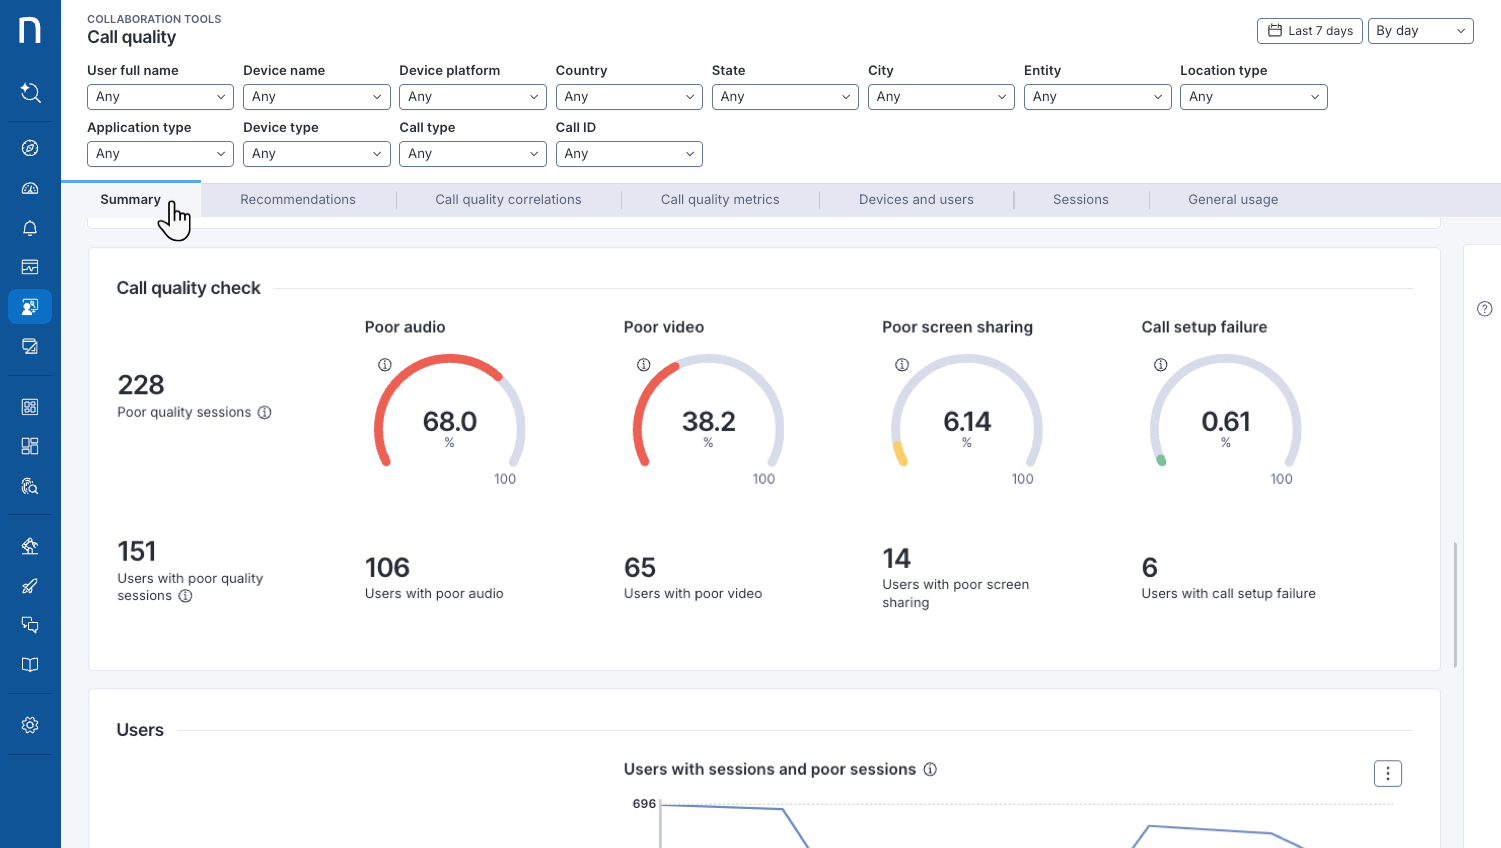
The **Summary** tab in the **Call Quality** dashboard uses DEX scores and data on **Poor calls** to highlight their impact on users.
Use the **Summary** tab main sections for an overview of the user experience with collaboration applications:
{% hint style="warning" %}
The **Call type** widget only provides accurate data for Microsoft Teams, and does not have feature parity with Zoom.
{% endhint %}
Call quality
Indicates overall call quality based on:
* Audio quality
* Video quality
* Screen share quality
Session health
Assesses **Session** quality, **Call type**, and **Call quality** based on:
* Overall session health metrics of the service.
* Trend analysis for patterns or degradation identification.
* Most impacted call types.
* Detailed breakdown of technical issues— audio, video, screen sharing, connectivity.
User information
* Identifies affected users and correlates issues with specific platforms or applications.
* Shows the distribution of **Poor calls** by user role and department, which helps you determine if issues are isolated or widespread.
Alerts
* Displays relevant alerts related to call quality degradation.
* Supports proactive monitoring and management.
{% hint style="info" %}
DEX metrics exclude filters for **Application type**, **Call ID** and **Device type**.
{% endhint %}
### Recommendations
The **Recommendations** tab in **Call Quality** organizes recommendations into sections to help identify issues by category, supporting efficient troubleshooting and proactive decision-making.
Use the main sections of the **Recommendations** tab to establish preventive maintenance schedules and resolve problems with targeted solutions:
Improve connectivity
* Identifies connectivity issues by location
* Provides Wi-Fi network performance metrics:
* Networks with poor transmission rates and signal strength
Consolidate application versions
* Identifies issues due to application version discrepancies
* Breaks down Microsoft Teams and Zoom versions across Windows and macOS
Fix hardware issues
{% hint style="warning" %}
The system only displays hardware drivers and driver versions for Microsoft Teams, as this feature is not guaranteed to work with Zoom.
{% endhint %}
* Shows the microphones and speakers used by employees.
* Prevent the use of non-standard or unsupported audio devices.
* Highlights microphone, speakers and Wi-Fi driver versions.
* Identify driver version inconsistencies or outdated drivers
* Correlates hardware driver issues with call quality.
Update applications and drivers
* Tracks application crashes and freezes for Microsoft Teams and Zoom by version.
* Identifies devices impacted by application issues.
* Identifies devices with audio processing problems.
Reboot Devices
* Identifies devices that need to be restarted to maintain call quality
### Call quality correlations
The **Call quality correlations** tab in **Call quality** dashboard groups users affected by poor call quality based on their profile, location, device attributes and specific hardware usage.
Use the **Call quality correlations** tab to:
* Pinpoint and dissect groups affected by poor call quality for troubleshooting and investigations.
* Improve communication with employees by targeting affected groups.
{% hint style="info" %}
Hover over the information icon in any widget for a detailed description of the call quality correlation metric.
{% endhint %}
### Call quality metrics
The **Call quality metrics** tab in **Call Quality** dashboard provides insights into call performance and factors affecting poor call quality.
Use the **Call quality correlations** tab to:
* Assess call performance based on four key metrics: jitter, packet loss, round-trip time (RTT), frame rate and frame loss percentage.
* Identify underlying reasons for poor call quality.
{% hint style="warning" %}
Refer to the [Getting Started with Collaboration Experience](/platform/user-guide/collaboration-experience/getting-started-with-collaboration-experience.md#gettingstartedwithcollaborationexperience-definingthecallquality) to learn in detail how the system defines call quality.
{% endhint %}
### Devices and users
The **Devices and users** tab in **Call Quality** dashboard provides you with the devices and employees most impacted by low-quality calls.
Use the **Devices and users** tab to—in this order:
1. Identify impacted devices.
2. Correlate call quality with device properties and performance.
3. Correlate call quality with device connectivity.
4. Identify impacted users.
### Sessions
The **Sessions** tab in **Call Quality** dashboard provides a comprehensive view of all sessions that occurred within a chosen timeframe, accompanied by insightful data regarding their quality, contextual details and overall performance.
#### Filtering the Sessions tab for granular analysis
Filter the results by applying filters at the top of the page. For example:
* Filtering on a specific call ID gives you a holistic understanding of dedicated calls.
* Analyze various call participants, pinpoint their connection origin and identify the application versions used.
* Determine if the experience of some call participants affects other employees joining the call.
* Filtering a specific employee and their call setup can uncover shared patterns and identify underlying factors that influence digital employee experience (DEX). You can then drill down deeper into the experience of a specific call participant.
Additionally, filter the results based on the name of the employee or device to:
* Assess their overall experience.
* View any isolated or recurring issues.
* Identify their behavior trends or patterns.
### General usage
The **General usage** tab in **Call Quality** dashboard provides insights into collaboration application utilization by offering information on devices, equipment and features used during calls.
Use the **General usage** tab for:
* Effective resource allocation to support leading devices.
* Tailored collaboration experience based on popular equipment and features.
***
RELATED CONTENT:
* [Navigating the web interface](/platform/getting-started/navigating-the-web-interface.md)
* [Analyzing collaboration experience](/platform/user-guide/collaboration-experience/getting-started-with-collaboration-experience.md)
---
# Agent Instructions
This documentation is published with GitBook. GitBook is the documentation platform designed so that both humans and AI agents can read, navigate, and reason over technical content effectively. Learn more at gitbook.com.
## Querying This Documentation
If you need additional information that is not directly available in this page, you can query the documentation dynamically by asking a question.
Perform an HTTP GET request on the current page URL with the `ask` query parameter, and the optional `goal` query parameter:
```
GET https://docs.nexthink.com/platform/user-guide/collaboration-experience/getting-started-with-collaboration-experience/using-collaboration-tools.md?ask=&goal=
```
`ask` is the immediate question: it should be specific, self-contained, and written in natural language.
`goal` is optional and describes the broader end goal you are ultimately trying to accomplish on behalf of the user. GitBook uses it to tailor the answer towards what is most useful for that goal.
The response will contain a direct answer to the question and relevant excerpts and sources from the documentation.
Use this mechanism when the answer is not explicitly present in the current page, you need clarification or additional context, or you want to retrieve related documentation sections.