# Usage guide: AWS WorkSpaces and AppStream essentials
{% hint style="warning" %}
This page outlines various ways to use the pack, including use case examples.
Administrators can refer to the [Configuration guide: AWS Workspaces and AppStream essentials](https://docs.nexthink.com/platform/library-packs/vdi/aws/aws-workspaces-and-appstream-essentials/configuration-guide-aws-workspaces-and-appstream-essentials) to set up and customize the installed content.
{% endhint %}
The **AWS Workspaces and AppStream essentials** library pack enables IT administrators to:
* Monitor the health and status of AWS WorkSpaces and AppStream virtual machines in real time.
* Monitor virtual machines with high uptime, which require a reboot.
* Identify virtual machines with poor performance that affect the end-user experience.
This pack equips IT teams to detect and address AWS WorkSpaces and AppStream performance or availability issues before users are impacted.
## Library pack uses
{% hint style="info" %}
Jump to [Use cases](#use-cases) on this page to see relevant scenario applications.
{% endhint %}
### Virtual machine monitoring
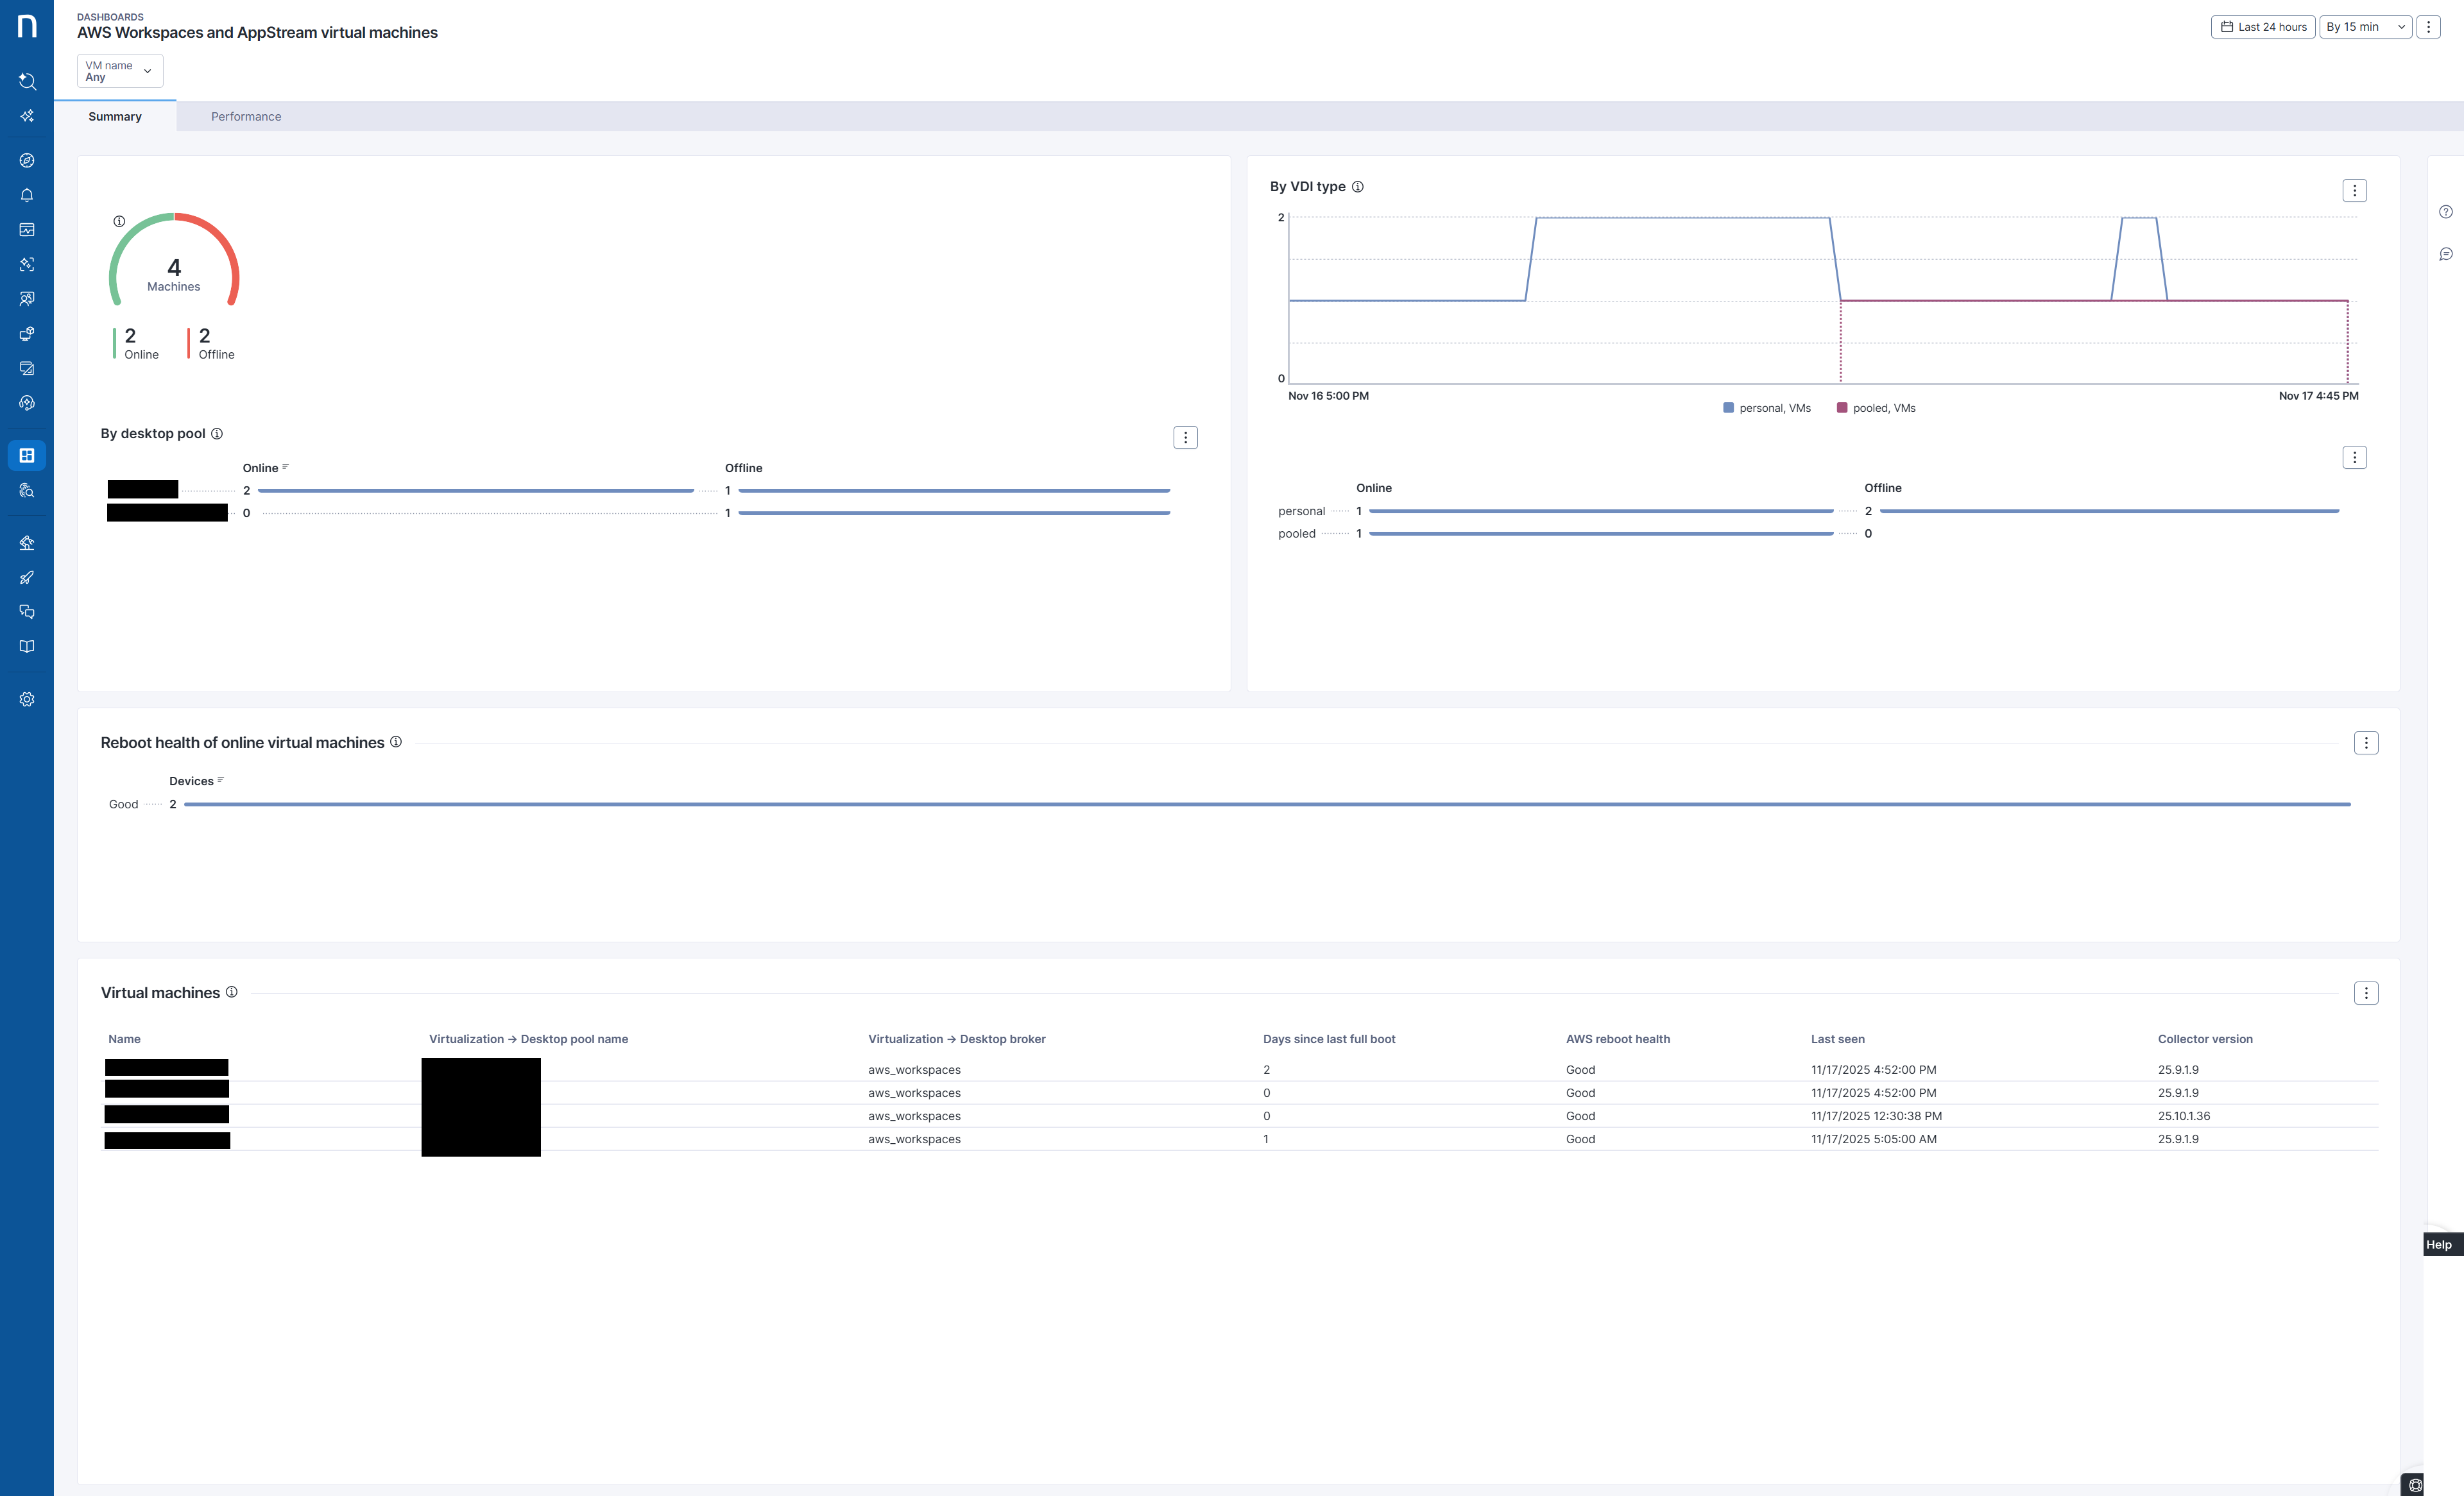
The AWS WorkSpaces and AppStream virtual machine monitoring dashboard is the starting point for VM diagnosis. It provides a dedicated environment for managing the online/offline VM distribution, reboot health tracking, and performance insights into AWS WorkSpaces and AppStream machines.
#### Visibility into online/offline VM distribution
With the Summary tab on the provided AWS WorkSpaces and AppStream virtual machine monitoring dashboard, you can quickly determine the online/offline status of your VMs, with breakdowns by desktop pool and VDI type.
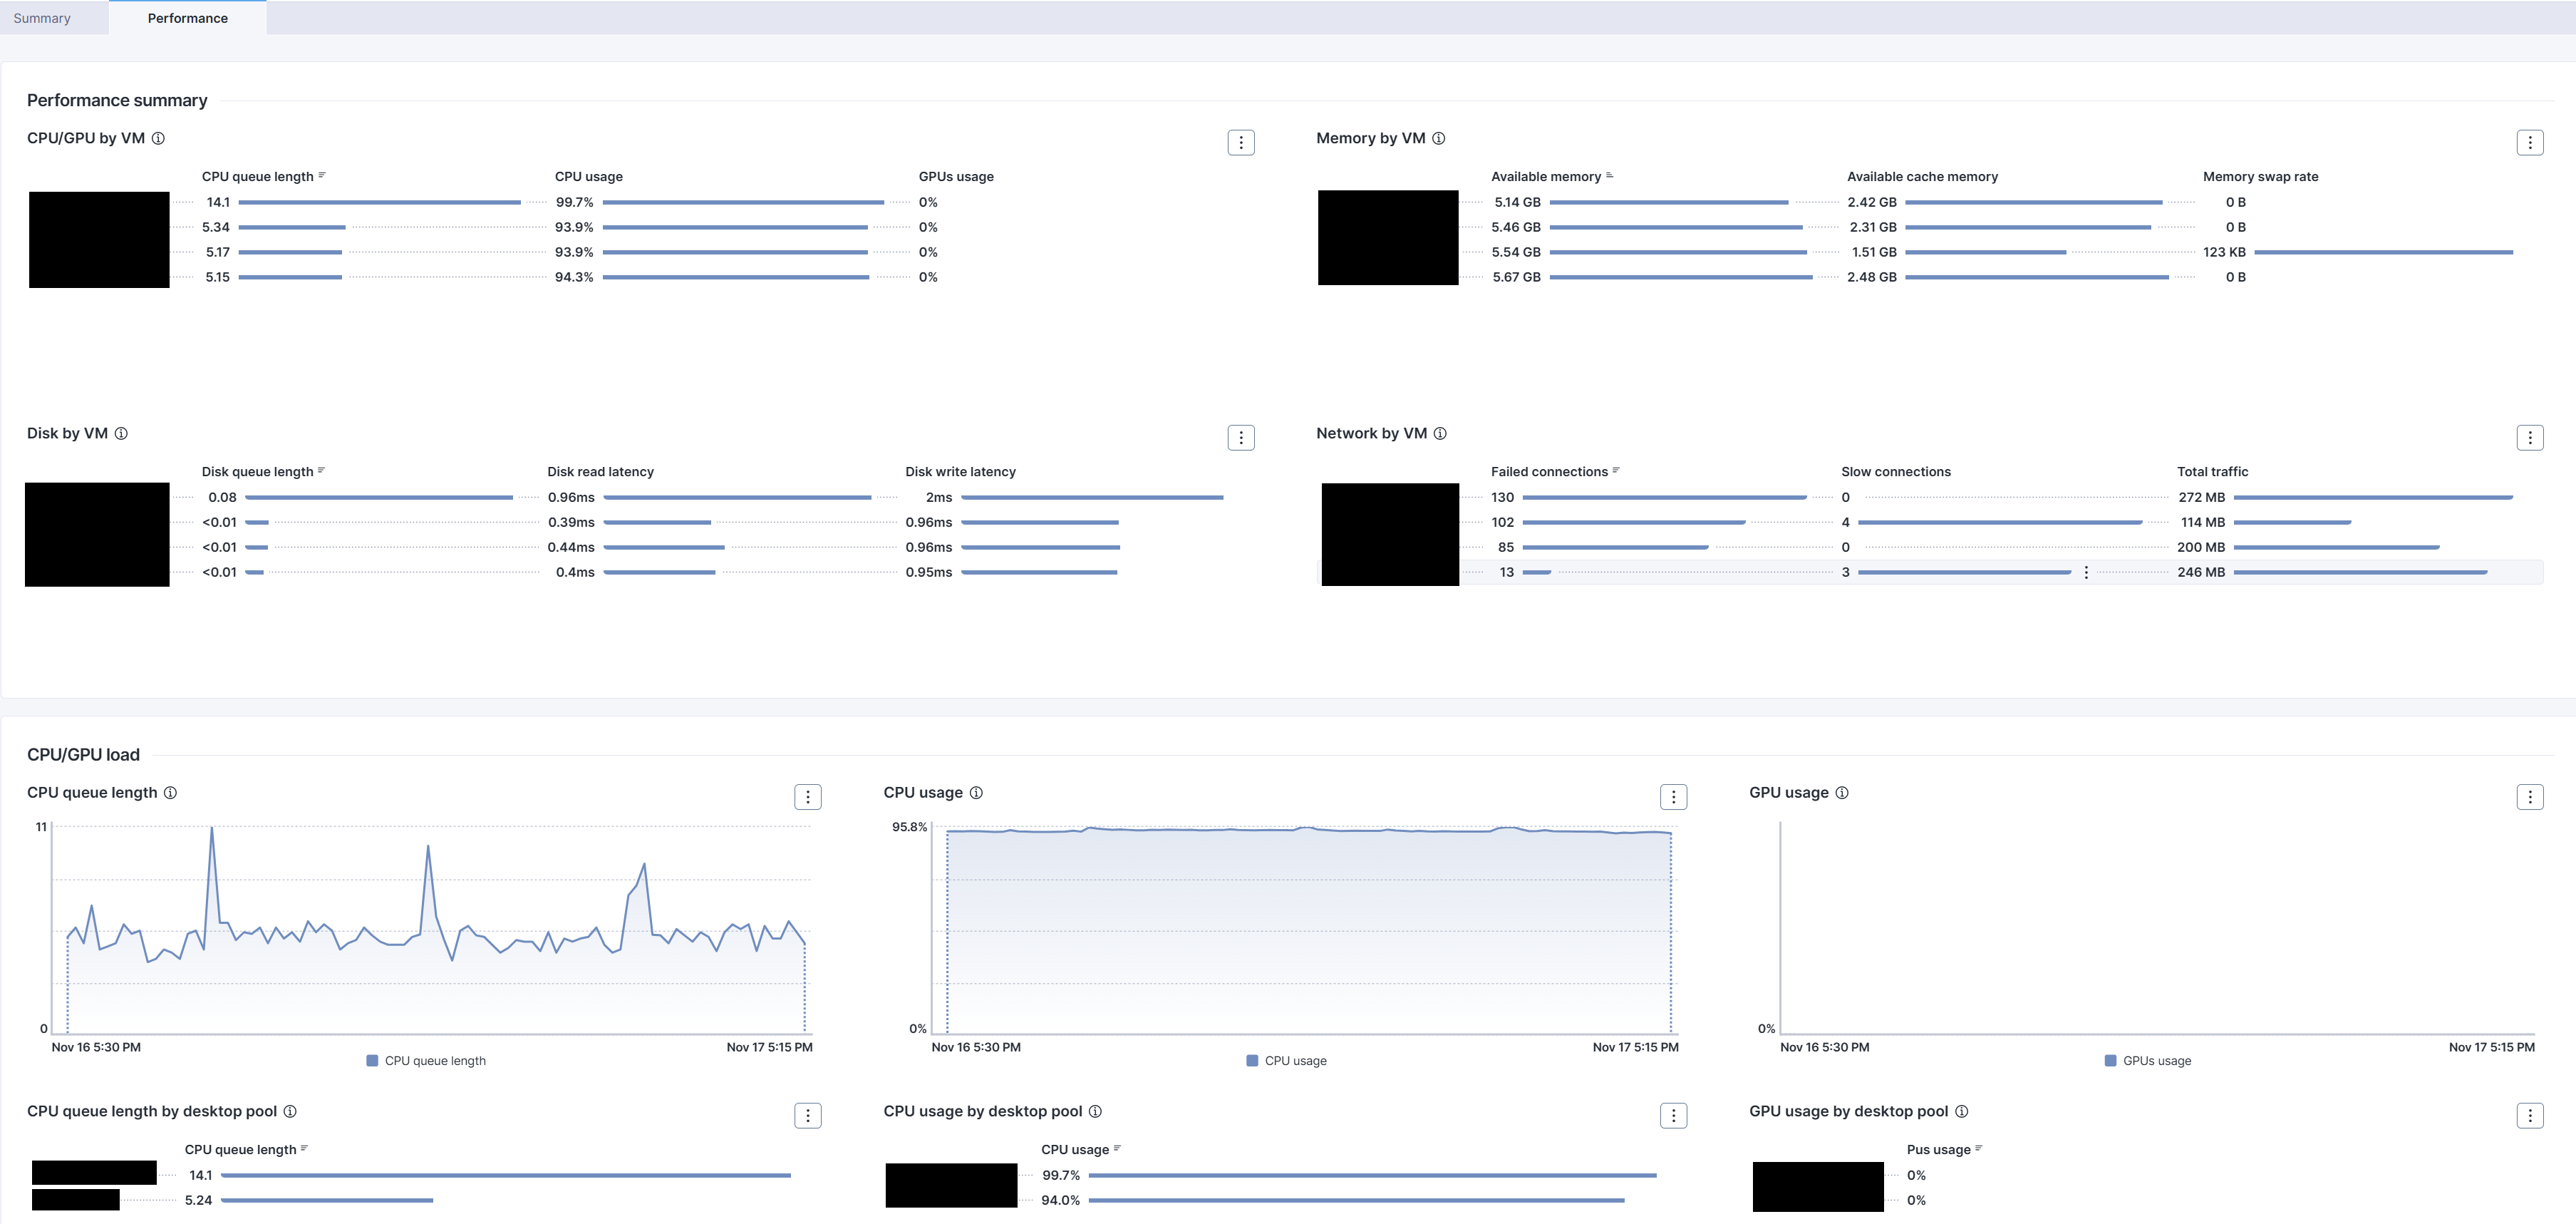
#### Virtual machine performance overview
The Performance Overview tab on the AWS WorkSpaces and AppStream virtual machine monitoring dashboard focuses on hardware load and resource utilization across your virtual desktop session hosts. It helps you identify infrastructure bottlenecks before they affect the end-user experience.
It organizes telemetry into four health groups:
* **CPU/GPU:** Normalized CPU queue length, overall CPU usage, and GPU utilization for graphics-intensive pools.
* **Memory:** Available memory, available cache, and swap activity to reveal pressure and paging.
* **Storage:** Disk queue length and read/write latencies to surface storage contention.
* **Network:** Failed connections, slow connection establishment, and total traffic to highlight connectivity and saturation patterns.
## Use cases
In addition to the relevant use cases covered below, you may uncover other troubleshooting scenarios specific to your environment.
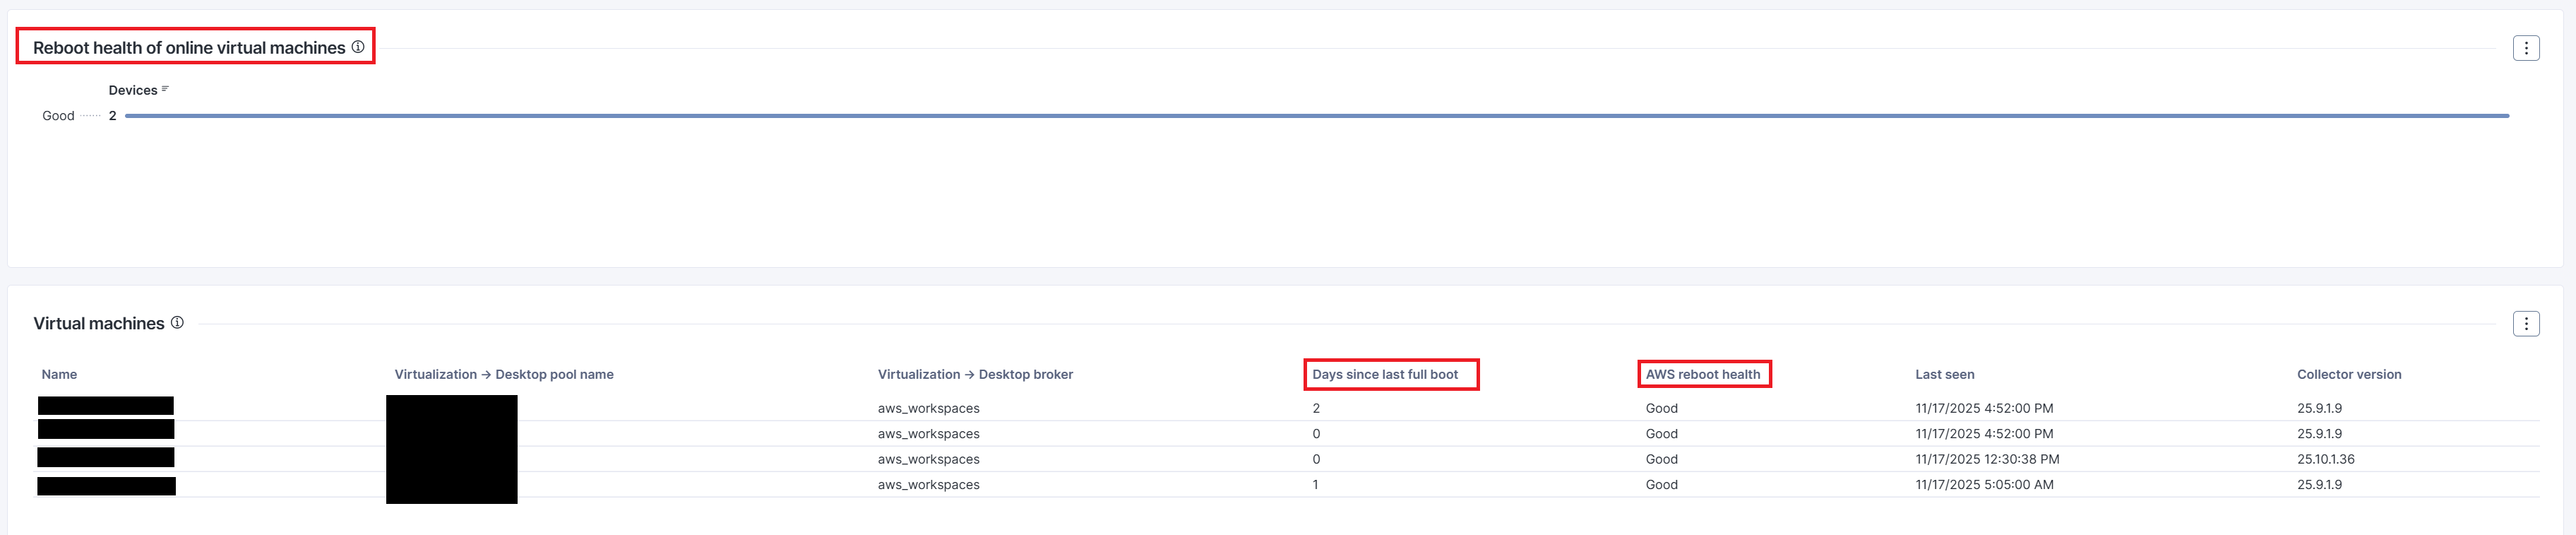
### Investigate devices with poor reboot health
The reboot health of a VM is determined by the custom field "AWS reboot health" included with this pack. The parameters for 'good, average, and poor' are configurable. This information is summarized in the dashboard, which features a dedicated bar chart that displays the number of devices in each category. This allows you to drill down to any devices that have not rebooted for a long period, which may require further investigation.
### Identify virtual machines with the worst performance
The Performance summary section on the Performance tab is designed to facilitate swift identification of virtual machines experiencing performance issues in the following areas: CPU/GPU, memory, disk, and network. Performance in these areas is essential for optimal system functionality.
After identifying the relevant VMs, VDI admins can focus on them using a VM name filter and detailed performance widgets on the same tab. It is possible to correlate performance issues with desktop pools using the same tab for the breakdown. Additionally, the Open device view feature provides a comprehensive, detailed overview of each affected VM.
***
RELATED TOPICS
* [](https://docs.nexthink.com/platform/library-packs/vdi/aws/aws-workspaces-and-appstream-essentials "mention")
* [configuration-guide-aws-workspaces-and-appstream-essentials](https://docs.nexthink.com/platform/library-packs/vdi/aws/aws-workspaces-and-appstream-essentials/configuration-guide-aws-workspaces-and-appstream-essentials "mention")