> For the complete documentation index, see [llms.txt](https://docs.nexthink.com/platform/llms.txt). Markdown versions of documentation pages are available by appending `.md` to page URLs; this page is available as [Markdown](https://docs.nexthink.com/platform/ja/user-guide/applications/monitoring-applications/monitoring-web-applications/performance/page-loads.md).
# ページの読み込み
パフォーマンスの低下は従業員からよく寄せられる不満であり、デバイス、ネットワーク、インフラストラクチャ、またはアプリケーションに起因する可能性があります。 Software as a Service(SaaS)アプリの場合、問題が会社のネットワークの外部にある可能性もあります。
**Page Loads** ダッシュボードでは、**Frustrating** ページロード指標を使用して、最も問題のある Web アプリを明らかにします。 **Page Loads** は、内訳、棒グラフ、およびデバイスレベルのポップアップによるトラブルシューティングをサポートします。
ソフトナビゲーションおよびハードナビゲーションの推定の詳細については、[Page loadsメトリックについて](/platform/ja/user-guide/applications/monitoring-applications/monitoring-web-applications/performance/page-loads/understanding-the-page-loads-metric.md)のドキュメントを参照してください。
## **Page Loads Insights の活用**
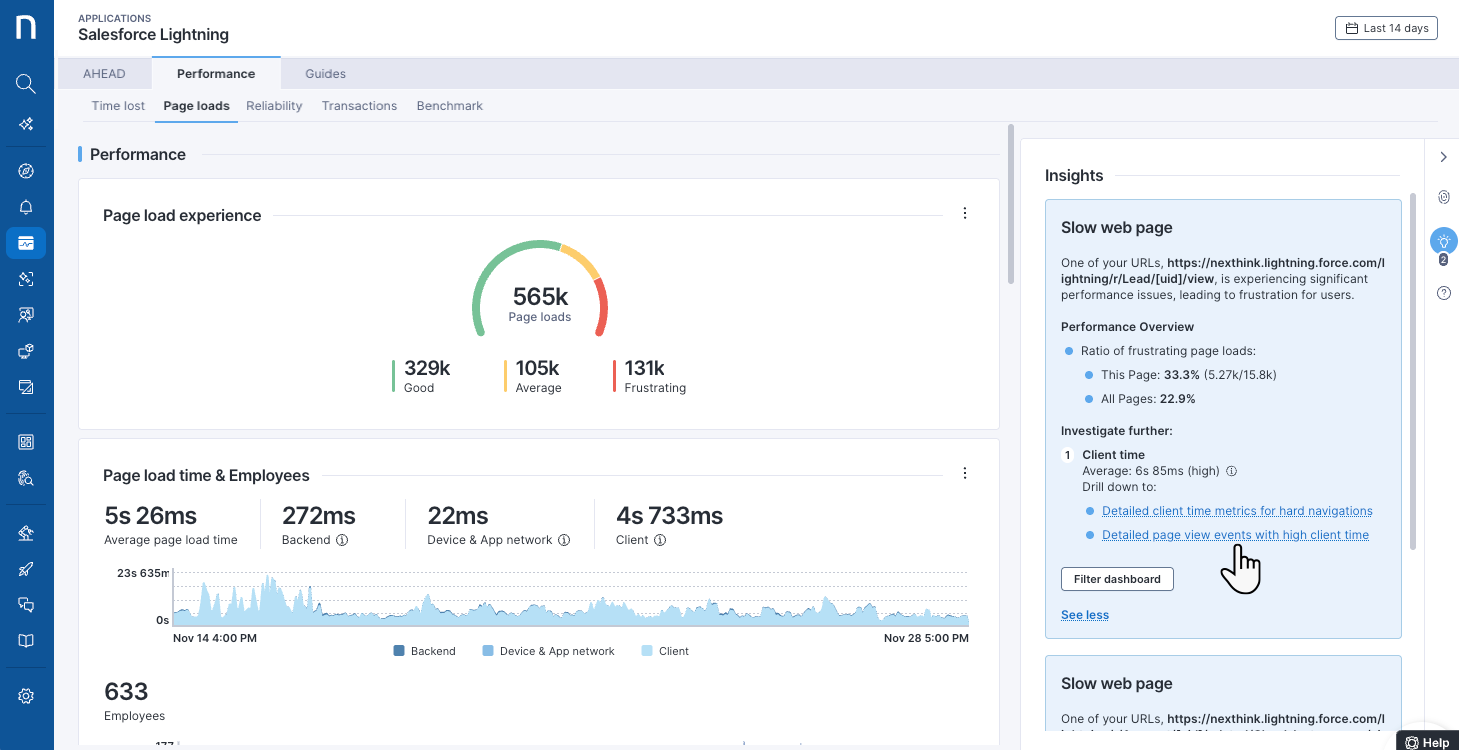
右側の **Insights** パネルでは、アルゴリズムを使用して影響を定量化し、考えられる根本原因を特定し、バックエンド、ネットワーク、クライアントの時間を評価することで、最も不満の多いページを強調表示します。別の期間を選択すると、異なるインサイトが表示される場合があります。
さらに詳しく分析するには:
* 右側の **Insights** パネルを開くと、関連する **Investigations** のドリルダウンが提案されます。
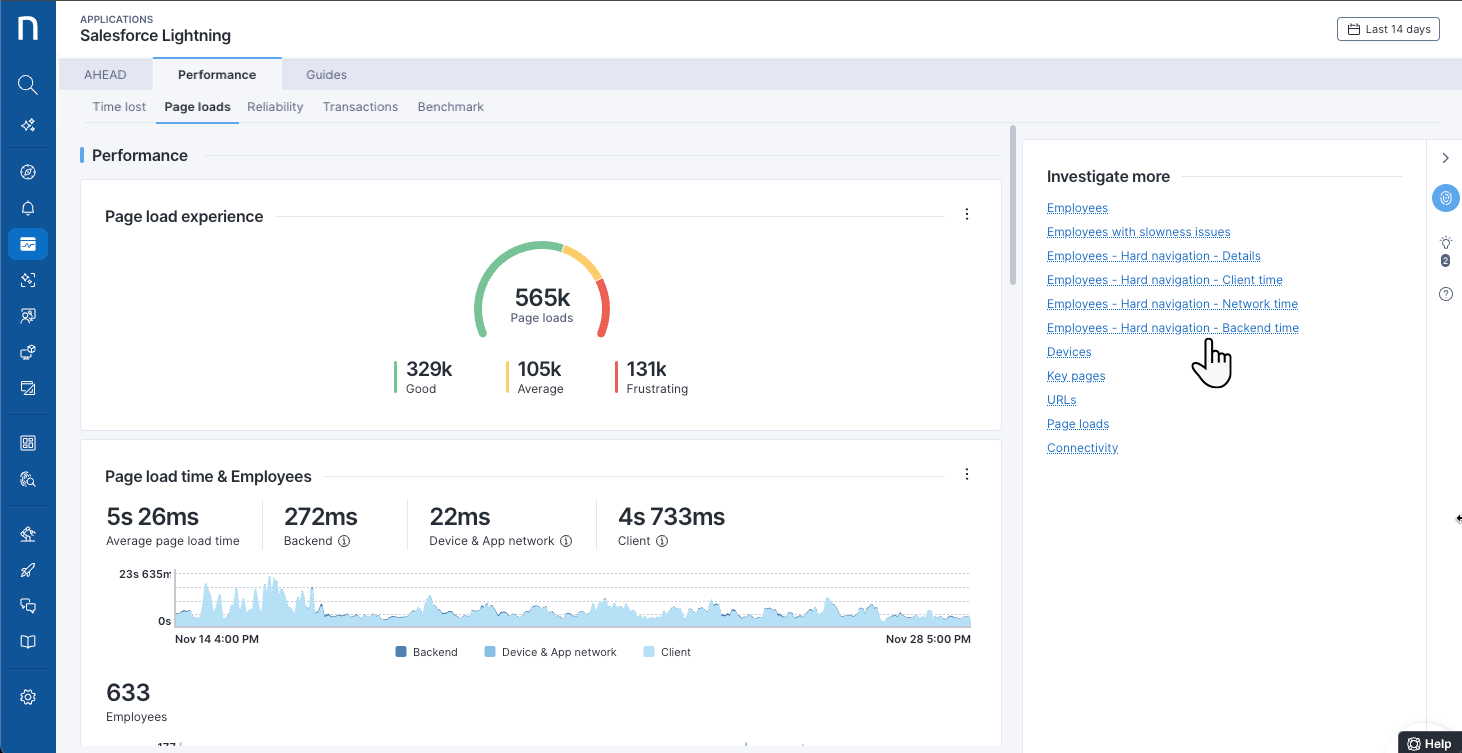
* または、あらかじめ定義されたドリルダウンオプションを提供する右側の **Investigate more** パネルを使用します。これらのリンクから、現在のダッシュボードコンテキストに関連する調査結果に移動できます。
Nexthink は、Web アプリケーション設定で定義された[主要ページと収集された URL](#key-pages-and-urls)のインサイトを提供します。
{% hint style="warning" %}
システムがインサイトを見つけられない場合、**Insights** パネルに *No insights found!* というメッセージが表示されます。
{% endhint %}
***
## Page Loads ダッシュボードの解釈
**ページロード**ダッシュボードには、次のセクションに分類されたウィジェットが含まれます:
* [#performance](#performance "mention")
* [#top-breakdowns](#top-breakdowns "mention")
* [#other-breakdowns](#other-breakdowns "mention")
{% hint style="info" %}
ソフトナビゲーションおよびハードナビゲーションの推定の詳細については、[Page loadsメトリックについて](/platform/ja/user-guide/applications/monitoring-applications/monitoring-web-applications/performance/page-loads/understanding-the-page-loads-metric.md)のドキュメントを参照してください。
{% endhint %}
### パフォーマンス
**Performance** セクションでは、ページロード Experience およびページロード時間の観点から、アプリケーションの概要を表示します。
ページロード Experience
**Page load experience** ウィジェットには、**良好**、**平均的**、**不満あり**のページロードの内訳を示すゲージチャートが表示されます。
これらの境界値は、Web アプリケーションに対する[設定済みのしきい値](/platform/ja/user-guide/applications/setting-up-and-managing-applications/configuring-applications/configuring-web-applications/thresholds.md)に対応します。
ページロード時間 & 従業員
このセクションを使用して、パフォーマンスの経時的な変化を特定します
* **Average page load time** ウィジェットには、**Backend**、**Device and App network**、および **Client** カテゴリの面グラフが表示されます。
* **従業員数**チャートは、アプリケーションタブがフォーカスされていたか、従業員に表示されていたかにかかわらず、少なくとも一度ページロードアクションを実行した従業員数を示します。視覚的に簡単に関連付けられるよう、このタイムラインは上記の **Average Page Load Time** チャートに対応付けられています。
### 主要な内訳
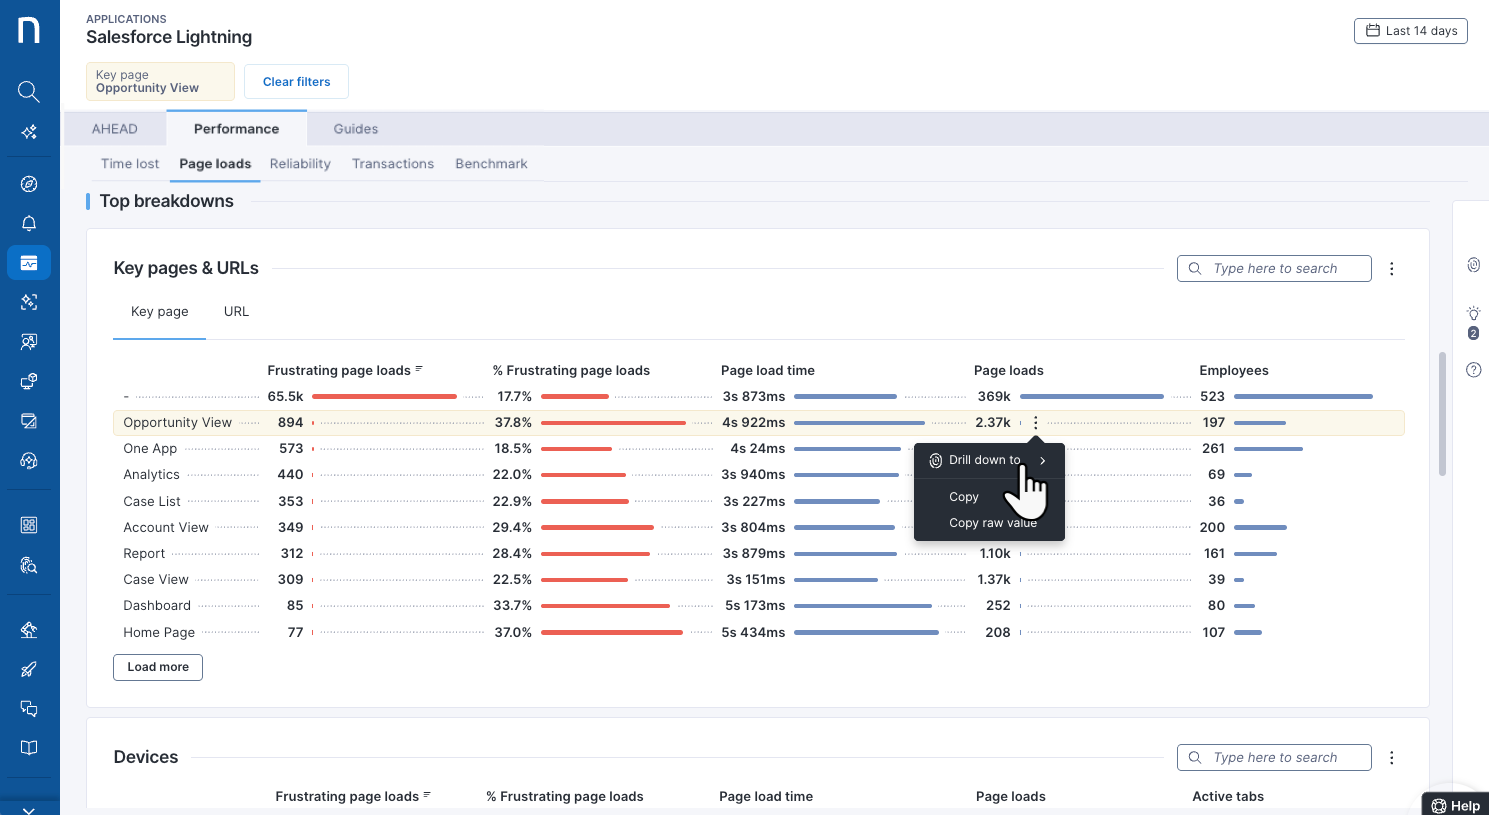
**主要な内訳** セクションには、不満の多いページロード数が最も多い主要ページ、URL、デバイスが表示されます。
#### 主要ページと URL
Web アプリケーションには、パフォーマンス特性が異なるさまざまなページとモジュールが含まれています。このセクションの両方のタブを使用して、次の単位でデータを表示します:
* 最も不満を引き起こす、Web アプリケーション用に Nexthink で設定された **主要ページ**。
* 最も不満を引き起こす **URL**。 Web アプリケーションの主要ページを設定する際は、この URL リストを参照してください。
ウィジェットの検索バーを使用して、対象の主要ページまたは URL をすばやく見つけます。
{% hint style="warning" %}
アプリケーションの[URL 収集](/platform/ja/user-guide/applications/setting-up-and-managing-applications/configuring-applications/configuring-web-applications.md#configuringwebapplications-collectingurls)が無効になっている場合、**主要ページと URL** の内訳には、Nexthink で設定された主要ページのみが表示されます。
{% endhint %}
#### デバイス
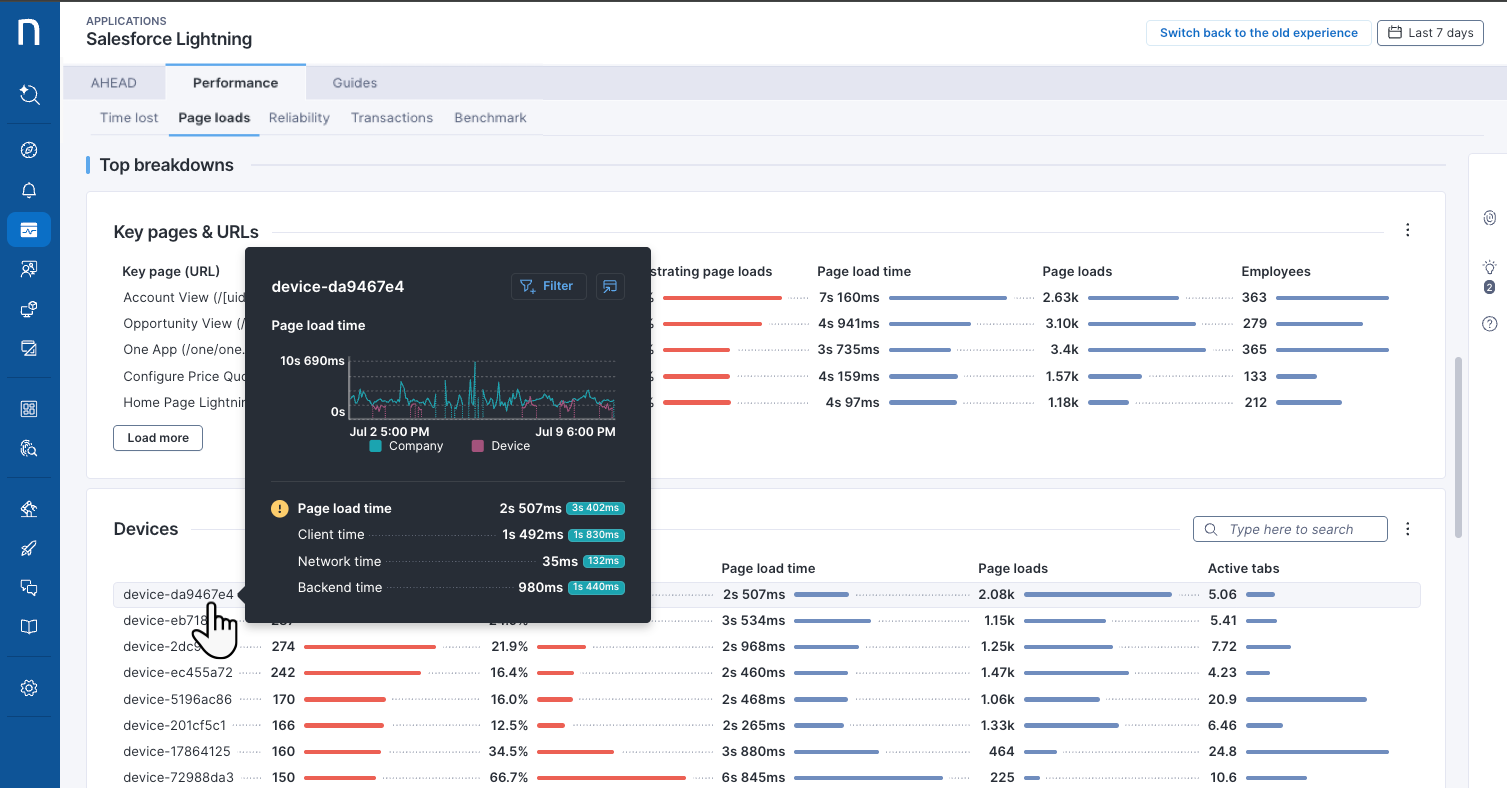
**Devices** テーブルには、不満の多いページロード数が最も多いデバイスが表示されます。
デバイス名にカーソルを合わせると、次の質問に答えるための詳細情報を含むポップアップが表示されます:
* *これは新しい問題ですか。それとも、このページは以前から常に遅かったのですか?*
* *これはデバイス固有の問題ですか。それとも、他のデバイスにも影響しますか?*
ポップアップには、選択したデバイスの **Page load times** が組織全体の他のデバイスと比較して表示され、**Client**、**Network**、**Backend** の時間も含まれます。次のことができます:
* 選択したデバイスでページを**フィルタリング**します。
* リンクアイコンをクリックすると、デバイスのトラブルシューティングオプションをさらに利用できる **Device View** ページが開きます。
### その他の内訳
**その他の内訳** セクションには、**Location**、**Organization**、および **Technical** ウィジェットが含まれます。
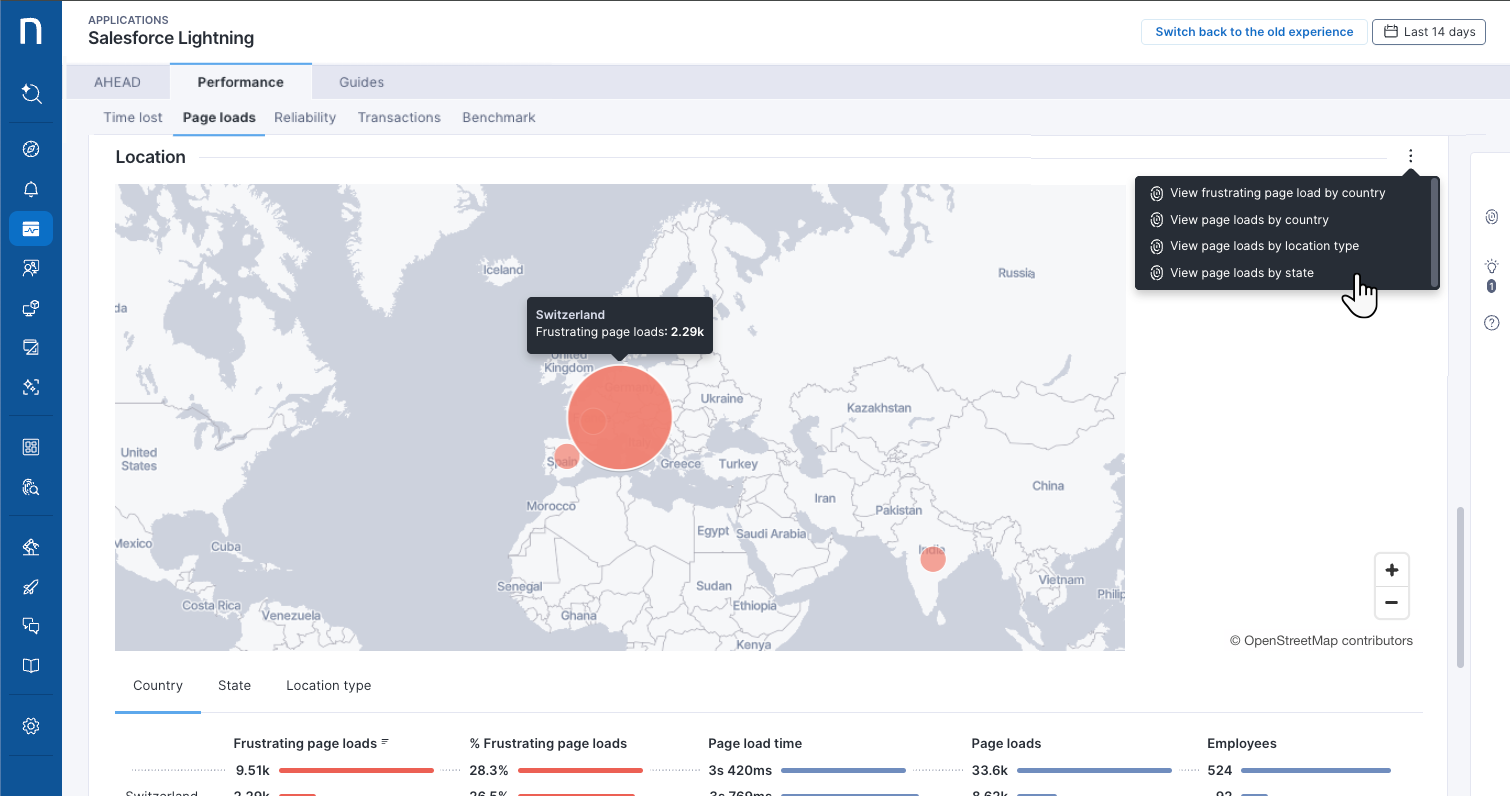
#### 場所
インタラクティブマップを使用して、従業員が **Frustrating page loads** を経験している場所を特定します。場所にカーソルを合わせると、詳細情報が表示されます。
**Location** ウィジェットのテーブルには、デバイスの **国**、**都道府県**、および **ロケーションタイプ** に基づく主要な指標が表示されます。
{% hint style="info" %}
位置情報データは地理位置情報機能に基づいており、この機能は[製品設定](/platform/ja/user-guide/administration/system-configuration/data-management/environment/product-configuration.md)ページで有効にする必要があります。
{% endhint %}
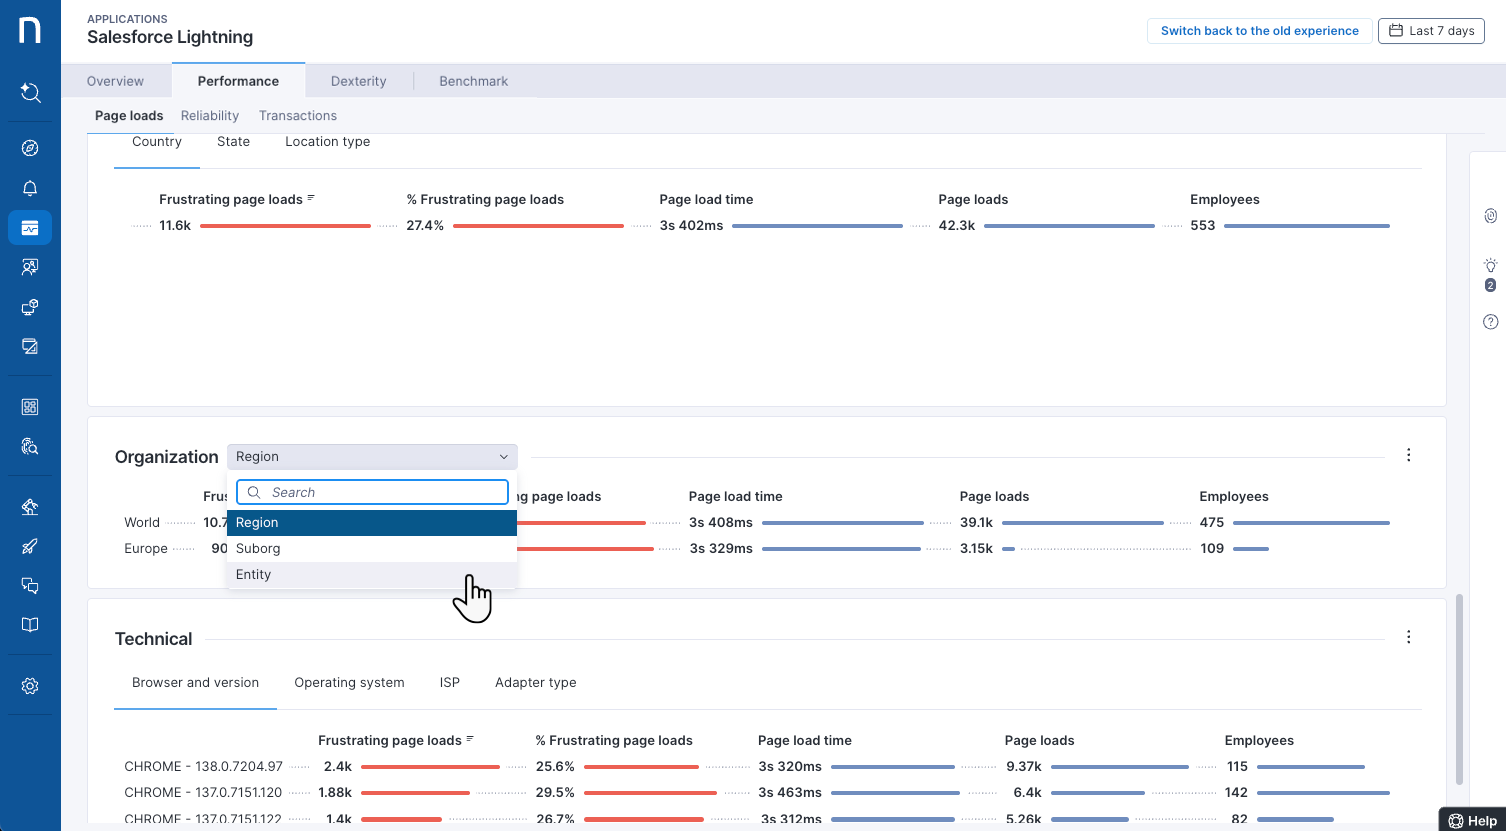
#### 組織
**Organization** テーブルには、組織の分類別に指標が表示されます。ドロップダウンリストから組織レベルを選択します。
詳細については、[製品設定](https://docs.nexthink.com/platform/ja/user-guide/administration/system-configuration/product-configuration)ドキュメントを参照して、エンティティとカスタム分類を定義する方法について学んでください。
#### 技術
**Technical** テーブルには、**Browser and version** や **Operating system** などの技術的なデバイスプロパティ別に分類された主要な指標が表示されます。
***
関連トピック
* [Page Loads 指標について](/platform/ja/user-guide/applications/monitoring-applications/monitoring-web-applications/performance/page-loads/understanding-the-page-loads-metric.md)
* [ページロードの遅延のトラブルシューティング](/platform/ja/user-guide/applications/monitoring-applications/monitoring-web-applications/performance/page-loads/troubleshooting-slow-page-loads.md)
---
# Agent Instructions
This documentation is published with GitBook. GitBook is the documentation platform designed so that both humans and AI agents can read, navigate, and reason over technical content effectively. Learn more at gitbook.com.
## Querying This Documentation
If you need additional information that is not directly available in this page, you can query the documentation by asking a question.
Perform an HTTP GET request on the following URL with the `ask` and `goal` query parameters:
```
GET https://docs.nexthink.com/platform/ja/user-guide/applications/monitoring-applications/monitoring-web-applications/performance/page-loads.md?ask=&goal=
```
`ask` is the immediate question: it should be specific, self-contained, and written in natural language.
`goal` is what the user is ultimately trying to achieve, the reason they need the answer. Sharing it helps GitBook give you a better, more relevant answer. A goal is most helpful when it describes the outcome the user wants rather than restating the question. For example, with `ask=how do I create an API token`, a goal like `automate deployments from our CI pipeline` lets GitBook tailor the answer to that use case.
The response will contain a direct answer to the question and relevant excerpts and sources from the documentation.
Use this mechanism when the answer is not explicitly present in the current page, you need clarification or additional context, or you want to retrieve related documentation sections.