> For the complete documentation index, see [llms.txt](https://docs.nexthink.com/platform/llms.txt). Markdown versions of documentation pages are available by appending `.md` to page URLs; this page is available as [Markdown](https://docs.nexthink.com/platform/ja/user-guide/applications/monitoring-applications/monitoring-web-applications/performance/benchmark.md).
# ベンチマーク
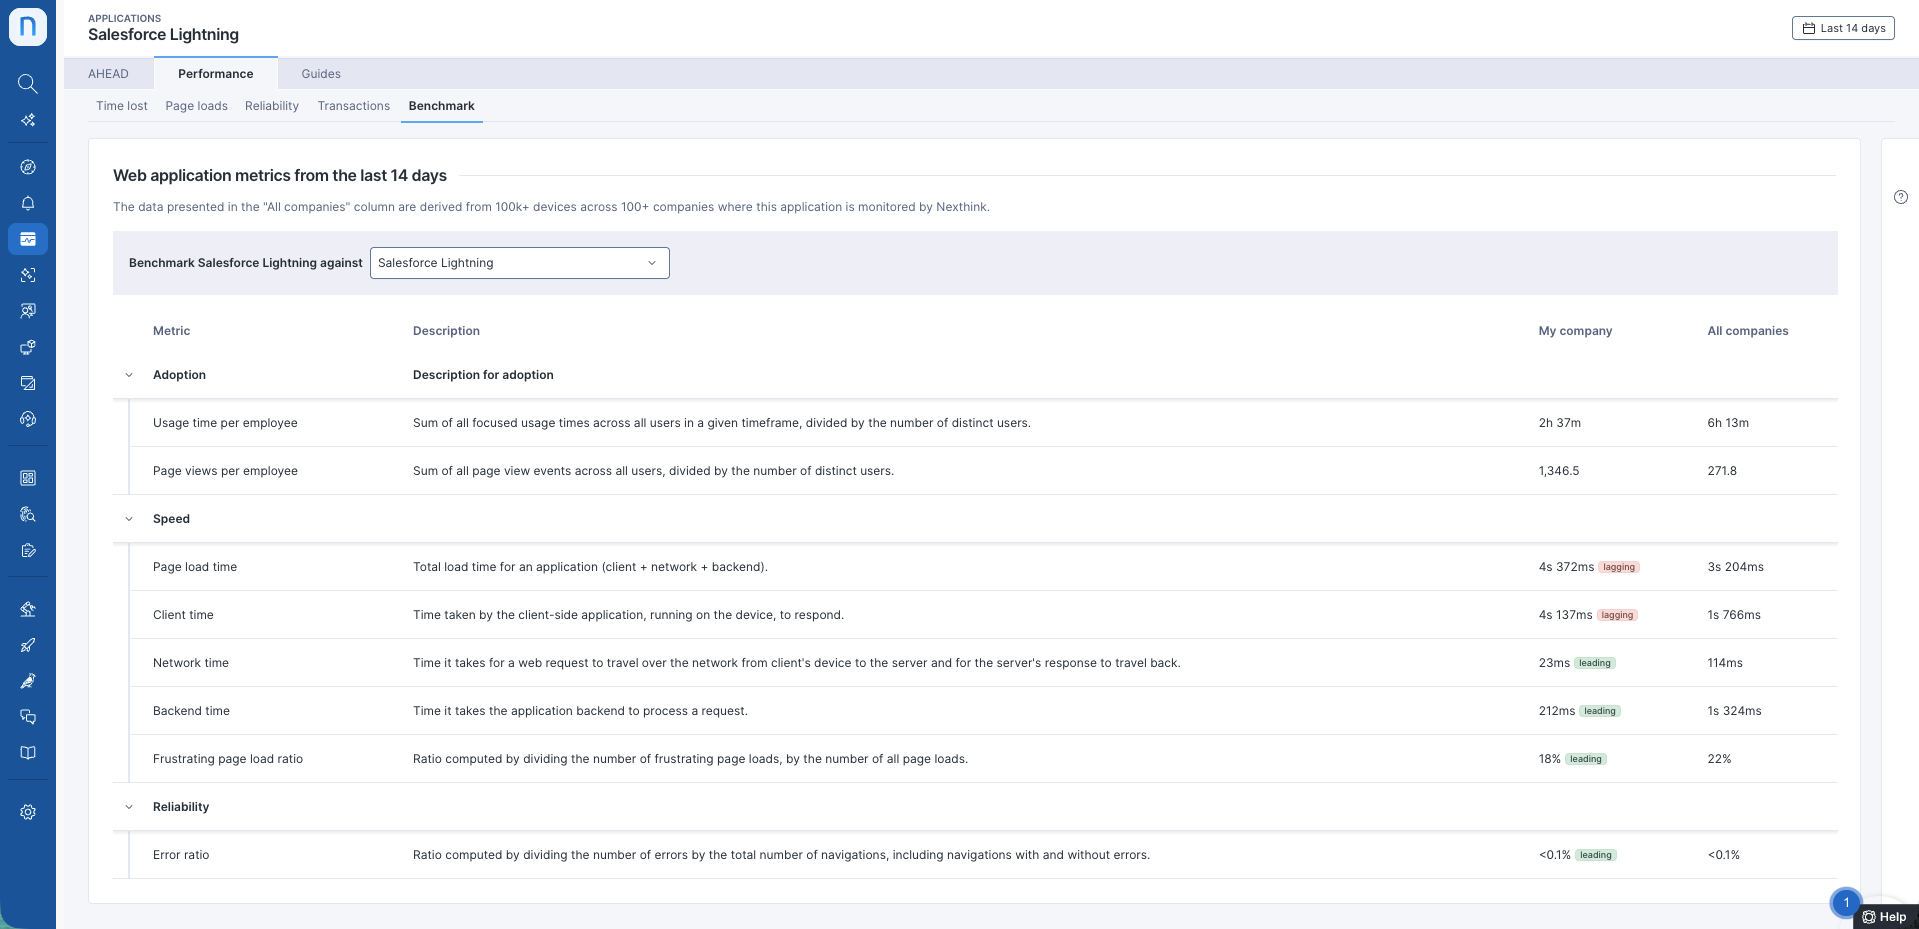
顧客横断データを使用して、アプリケーションの問題をより迅速かつ効果的に検出し、トラブルシューティングします。
## アプリケーションのベンチマーク
{% hint style="warning" %}
ベンチマーク機能は、有効な Application Experience ライセンスを持つ環境でのみ利用できます。設定済みのすべての Web またはハイブリッドアプリケーションに自動的に表示されます。
{% endhint %}
Nexthink は、ベンチマーク対象アプリケーションを特定するためのアルゴリズムベースのツールを提供します。現在のアプリケーションが Nexthink の顧客の間で広く使用されている場合は、候補が提示されます。そうでない場合は、パフォーマンスのベンチマーク用にドロップダウンリストからアプリケーションを選択できます。
1. ドロップダウンメニューからアプリケーションを選択し、そのパフォーマンスを現在のアプリケーションと比較します。
2. **自社**と**全社**で利用可能な[メトリクス](#reliability-metrics-1)を確認します。
* **自社**列には、自社のデバイスにインストールされた現在のアプリケーションのインスタンスからのデータが表示されます。
* **全社**列には、Nexthink が現在のアプリケーションを監視している、50 社を超える企業の 10,000 台を超えるデバイスからのデータが表示されます。
### ベンチマークメトリクス: 導入状況
| メトリック | 説明 |
| -------------- | ------------------------------------------------- |
| 従業員あたりの使用時間 | 指定した期間における全ユーザーのフォーカス中の使用時間の合計を、ユニークユーザー数で割った値です。 |
| 従業員あたりのページビュー数 | 全ユーザーのすべてのページビューイベントの合計を、ユニークユーザー数で割った値です。 |
### ベンチマークメトリクス: 速度
| メトリック | 説明 |
| --------------- | ------------------------------------------------------------- |
| ページロード時間 | アプリケーションの合計ロード時間(クライアント + ネットワーク + バックエンド)。 |
| クライアント時間 | デバイス上で実行されているクライアント側アプリケーションが応答するまでにかかる時間。 |
| ネットワーク時間 | Web リクエストがクライアントのデバイスからネットワークを介してサーバーに到達し、サーバーの応答が戻るまでにかかる時間。 |
| バックエンド時間 | アプリケーションのバックエンドがリクエストを処理するのにかかる時間。 |
| イライラするページロードの割合 | イライラするページロード数を、すべてのページロード数で割って算出した割合。 |
### ベンチマークメトリクス: 信頼性
| メトリック | 説明 |
| ----- | ----------------------------------------------------- |
| エラー率 | エラーのあるナビゲーションとないナビゲーションを含む、ナビゲーションの総数でエラー数を割って算出した割合。 |
この列には、Nexthink が現在のアプリケーションを監視しているすべての企業から集計されたパフォーマンスデータが表示されます。
---
# Agent Instructions
This documentation is published with GitBook. GitBook is the documentation platform designed so that both humans and AI agents can read, navigate, and reason over technical content effectively. Learn more at gitbook.com.
## Querying This Documentation
If you need additional information that is not directly available in this page, you can query the documentation by asking a question.
Perform an HTTP GET request on the following URL with the `ask` and `goal` query parameters:
```
GET https://docs.nexthink.com/platform/ja/user-guide/applications/monitoring-applications/monitoring-web-applications/performance/benchmark.md?ask=&goal=
```
`ask` is the immediate question: it should be specific, self-contained, and written in natural language.
`goal` is what the user is ultimately trying to achieve, the reason they need the answer. Sharing it helps GitBook give you a better, more relevant answer. A goal is most helpful when it describes the outcome the user wants rather than restating the question. For example, with `ask=how do I create an API token`, a goal like `automate deployments from our CI pipeline` lets GitBook tailor the answer to that use case.
The response will contain a direct answer to the question and relevant excerpts and sources from the documentation.
Use this mechanism when the answer is not explicitly present in the current page, you need clarification or additional context, or you want to retrieve related documentation sections.