> For the complete documentation index, see [llms.txt](https://docs.nexthink.com/llms.txt). Markdown versions of documentation pages are available by appending `.md` to page URLs; this page is available as [Markdown](https://docs.nexthink.com/platform/ja/user-guide/alerts-and-diagnostics/setting-up-and-managing-monitors/creating-custom-monitors/detecting-issues-impacting-multiple-devices.md).
# 複数のデバイスに影響する問題の検出
{% hint style="info" %}
NQL を使用して既存のアラートに関連付けられたデバイスを調査およびクエリする方法については、[アラートに関する FAQ](https://docs.nexthink.com/platform/ja/user-guide/alerts-and-diagnostics/alerts-faq.md#how-can-i-investigate-and-query-devices-associated-with-an-existing-alert)を参照してください。
{% endhint %}
複数のデバイスに影響する問題を検出することで、アプリケーションチームおよびネットワーク L2+ チームは、それぞれの担当領域におけるグローバルな問題にプロアクティブに対応できます。アプリケーションに影響する問題について、関連するアプリケーション所有者に通知します。次のユースケースを使用して、以下を評価します。
* 影響を受けるデバイスまたはユーザーの数。たとえば、特定のアプリケーションのクラッシュが発生したデバイスの数。
* デバイス全体で頻繁に発生する問題。たとえば、すべてのデバイスで発生した特定のアプリケーションのクラッシュ数。
どちらのアプローチも重要であり、多くの場合、相互に補完し合います。問題が受信者にとって無関係な場合にアラートのトリガーや通知の送信を回避するには、モニターのトリガー条件を設定する際にいずれかのアプローチを使用します。たとえば、すべてのデバイスにおける特定のアプリケーションのクラッシュ数が 20 を超え、かつ 5 台を超えるデバイスに影響する場合、システムはアラートをトリガーします。その後、システムはアプリケーション所有者に通知します。
以下のセクションでは、2つのユースケースについて詳しく説明します。
## 問題が発生しているデバイスまたはユーザー数の監視
複数のデバイスに影響する問題をプロアクティブに監視するために、問題が発生しているデバイスまたはユーザーの数を検出します。
`devices` または `mobile_devices` の集計数を返す NQL クエリを作成します。
アプリケーションがフォアグラウンドで実行中に発生したクラッシュのみをカウントします。必要に応じて、`by` キーワードを使用して結果をグループ化します。システムはグループごとにアラートをトリガーします。
```
devices
| with execution.crashes during past 24h
| where binary.name = "outlook.exe"
| compute crashes = countif(process_visibility == foreground)
| summarize nr_of_devices = count() by entity
```
### **通知**
システムは、すべてのデバイスに対して一度に通知を送信します。クエリに `by` 句が含まれている場合は、グループごとに個別に通知を送信します。通知には、値としてデバイス数のみが含まれます。影響を受けたすべてのデバイスの詳細は、Nexthink Web インターフェースで確認できます。
### **アラート概要ダッシュボード**
[アラート概要](https://docs.nexthink.com/platform/ja/user-guide/alerts-and-diagnostics/getting-started-with-alerts/responding-to-alerts/alerts-overview.md)ダッシュボードでは、アラートが1行に表示されます。グループ化が追加されている場合は、グループごとに別の行に表示され、グループ化に関するコンテキストも表示されます。
***
## デバイス全体で頻繁に発生する問題の監視
集計されたメトリック値に反映される、複数のデバイスにまたがる問題を検出します。
集計されたメトリック値を返す NQL クエリを作成します。必要に応じて、`by` キーワードを使用して結果をグループ化します。システムはグループごとにアラートをトリガーします。
```
execution.crashes during past 24h
| summarize
total_number_of_crashes = count(),
devices_with_crashes = device.count()
by binary.name
```
### **通知**
システムは、単一のメトリックに対して通知を送信します。クエリに `by` 句が含まれている場合は、グループごとに個別に通知を送信します。通知には、条件で定義された各メトリックのしきい値超過値に関する情報が含まれます。
### **アラート概要ダッシュボード**
[アラート概要](https://docs.nexthink.com/platform/ja/user-guide/alerts-and-diagnostics/getting-started-with-alerts/responding-to-alerts/alerts-overview.md)ダッシュボードでは、アラートがコンテキスト関連のラベルなしで1行に表示されます。グループ化が追加されている場合、アラートはグループごとに別の行に表示され、グループ化に関するコンテキストも表示されます。
NQL の詳細については、以下の NQL の例および [NQL データモデル](https://docs.nexthink.com/platform/ja/understanding-key-data-platform-concepts/nql-data-model.md) ドキュメントを参照してください。
***
## NQL の例
以下に、モニターの作成および編集に役立つ NQL クエリの例を示します。クエリを確認し、作成または編集するモニターに最も類似するものを選択します。クエリをコピーし、例として提供されているしきい値を含め、ユースケースに合わせて調整します。
### アプリケーションの特定の Web エラーを検出する
この NQL クエリは、特定のアプリケーションについてエラー数とエラーが発生したデバイス数を集計して返し、特定のエラーコードごとに個別にアラートをトリガーします。
{% code overflow="wrap" lineNumbers="true" %}
```
web.errors during past 1h
| where application.name in ["Jenkins"]
| where error.code !in [405, 404, 403]
| summarize nr_of_devices_impacted = device.count(), nr_of_errors = count() by label
```
{% endcode %}
### Web エラー率が高いアプリケーションを検出する
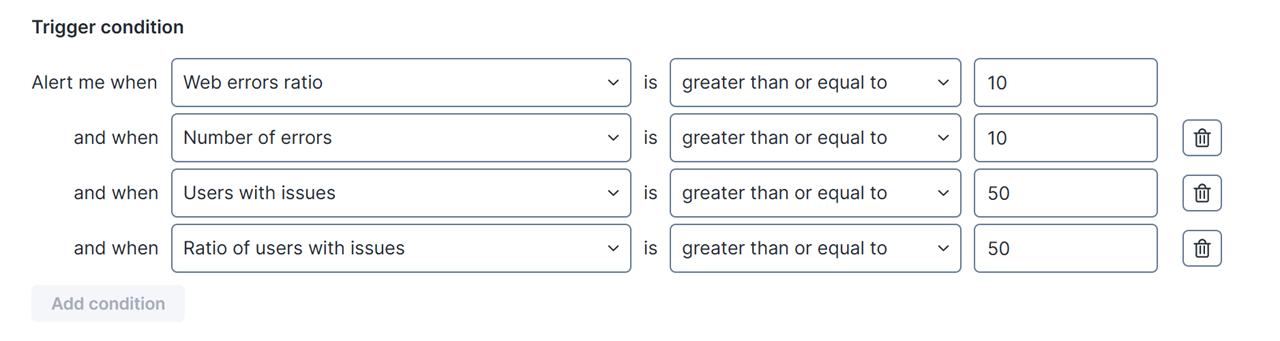
誤検知を回避するために、十分な使用量と十分な数の問題があることを確認できるよう、他のしきい値を選択します。
{% code overflow="wrap" lineNumbers="true" fullWidth="false" %}
```
application.applications
| with web.page_views during past 60min
| where is_soft_navigation = false
| compute total_number_of_page_views = number_of_page_views.sum(), all_users = user.count()
| with web.errors during past 60min
| compute number_page_views_with_error = error.number_of_errors.sum(), users_with_errors = user.count()
| summarize web_errors_ratio = number_page_views_with_error.sum() * 100 / total_number_of_page_views.sum(), number_of_errors = number_page_views_with_error.sum(), users_with_issues = users_with_errors.sum(), ratio_of_users_with_issues = users_with_errors.sum() * 100 / all_users.sum() by application.name
```
{% endcode %}
### バイナリでのクラッシュ数が多いことを検出する
{% code overflow="wrap" lineNumbers="true" %}
```
execution.crashes during past 24h
| summarize total_number_of_crashes = count(), devices_with_crashes = device.count() by binary.name
| sort total_number_of_crashes desc
```
{% endcode %}
### 国別の位置情報を使用して、起動時間が長いデバイスが多数あることを検出する
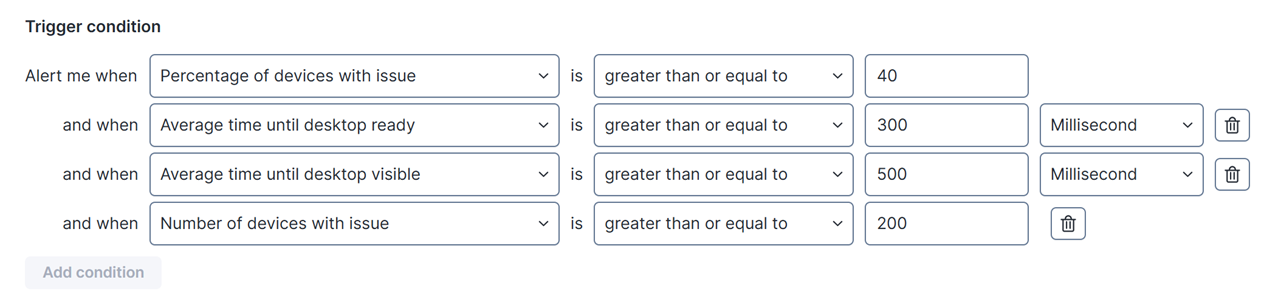
起動時間が長い状態は、`time_until_desktop_is_visible>= 60s` と定義されています
{% code overflow="wrap" lineNumbers="true" %}
```
devices
| with session.logins during past 24h
| compute total_devices = device.count(), avg_time_until_desktop_ready = time_until_desktop_is_ready.avg(), avg_time_until_desktop_visible = time_until_desktop_is_visible.avg()
| include session.logins during past 24h
| where time_until_desktop_is_visible>= 60s
| compute number_of_device_with_long_login = device.count()
| summarize percentage_of_devices_with_issue = number_of_device_with_long_login.sum() * 100 / total_devices.sum(), average_time_until_desktop_ready = avg_time_until_desktop_ready.avg(), average_time_until_desktop_visible = avg_time_until_desktop_visible.avg(), number_of_devices_with_issue = number_of_device_with_long_login.sum() by public_ip.country
```
{% endcode %}
### デスクトッププールあたりの平均 CPU キュー長が 3 以上の場合の仮想化アラート
{% code overflow="wrap" lineNumbers="true" %}
```
device_performance.events during past 30min
| where device.virtualization.desktop_pool != null
| summarize Average_cpu_queue_length = cpu_queue_length.avg() / number_of_logical_processors.avg() by device.virtualization.desktop_pool
```
{% endcode %}
---
# Agent Instructions
This documentation is published with GitBook. GitBook is the documentation platform designed so that both humans and AI agents can read, navigate, and reason over technical content effectively. Learn more at gitbook.com.
## Querying This Documentation
If you need additional information that is not directly available in this page, you can query the documentation by asking a question.
Perform an HTTP GET request on the following URL with the `ask` and `goal` query parameters:
```
GET https://docs.nexthink.com/platform/ja/user-guide/alerts-and-diagnostics/setting-up-and-managing-monitors/creating-custom-monitors/detecting-issues-impacting-multiple-devices.md?ask=&goal=
```
`ask` is the immediate question: it should be specific, self-contained, and written in natural language.
`goal` is what the user is ultimately trying to achieve, the reason they need the answer. Sharing it helps GitBook give you a better, more relevant answer. A goal is most helpful when it describes the outcome the user wants rather than restating the question. For example, with `ask=how do I create an API token`, a goal like `automate deployments from our CI pipeline` lets GitBook tailor the answer to that use case.
The response will contain a direct answer to the question and relevant excerpts and sources from the documentation.
Use this mechanism when the answer is not explicitly present in the current page, you need clarification or additional context, or you want to retrieve related documentation sections.